Notice: This Wiki is now read only and edits are no longer possible. Please see: https://gitlab.eclipse.org/eclipsefdn/helpdesk/-/wikis/Wiki-shutdown-plan for the plan.
Difference between revisions of "Linux Tools Project/LTTngLegacy/User Guide"
(→Statistics View) |
(→Statistics View) |
||
| Line 183: | Line 183: | ||
[[Image:StatisticsView.png]] | [[Image:StatisticsView.png]] | ||
| − | |||
| − | |||
== Control Flow View == | == Control Flow View == | ||
Revision as of 19:02, 26 November 2010
Introduction
LTTng (Linux Tracing Toolkit, next generation) is a highly efficient tracing tool for Linux that can be used to track down performance issues and debug problems involving multiple concurrent processes and threads. It consists of a set of kernel patches and a daemon, to collect the raw tracing data, as well as a set of tools to control, visualize and analyze the generated data.
The LTTng plug-in for Eclipse aims at replacing LTTv (LTTng visualizer), the component used to control, fetch, analyze and visualize traces produced by the LTTng tracer. A present, the LTTng Eclipse plug-in for Eclipse supports the following analyses: Control Flow, Resources and Statistics.
For more information about LTTng, refer to the project site
About Tracing
Tracing is a technique used to understand what is going on in a system in order to debug or monitor it. A tracer is the software used for tracing. Tracing can be used to debug a wide range of bugs that are otherwise extremely challenging. These include, for example, performance problems in complex parallel systems or real-time systems.
Tracing is similar to logging: it consists in recording events that happen in a system. However, compared to logging, it usually records much lower-level events that occur much more frequently. Tracers must therefore be optimized to handle a lot of data while having a small impact on the system. Tracers typically generate thousands of events per second. They generated trace frequently can easily contain millions of events and have sizes from many megabytes to tens of gigabytes.
Traces may include events from the operating system kernel (IRQ handler entry/exit, system call entry/exit, scheduling activity, network activity, etc). It can also consists of application events (a.k.a UST - User Space Tracing) or a mix of the two.
For the maximum level of detail, a tracing events may be viewed like a log file. However, trace analyzers and viewers are available to produce useful information from the raw data. These programs must be specially designed to handle quickly the enormous amount of data traces contain.
In the case of LTTng, low tracing overhead is achieved by instrumenting the Linux kernel with a set of custom patches. The same set of patches can be used for both Linux kernel as well as UST.
Traces and Experiments
In the scope of the LTTng plug-in for Eclipse, a trace is essentially a (very) large set of time-ordered LTTng events. The LTTng application can read these traces and provide a number of standard views to analyze their contents.
An experiment consists in an arbitrary number of aggregated LTTng traces for purpose of correlation. In the degenerate case, an experiment can consist of a single trace.
The experiment provides a unified, time-ordered stream of the individual LTTng trace events.
Getting Started
The LTTng plug-in for Eclipse is used to visualize and analyze kernel traces produced by the LTTng tracer. Controlling the recording and fetching of an LTTng trace from Eclipse is currently a work in progress therefore, currently the plug-in can only be used to visualize existing LTTng traces. To record your own trace, you will need to install the LTTng kernel patches and the LTTv application (refer to the LTTng site for more information on how to record and fetch traces).
If not already installed, you can download and install the LTTng plug-ins from the Eclipse update site (search for LTTng under Linux Tools).
The rest of this section provides instructions on how to complete the LTTng for Eclipse installation and verify that it is correct.
Installing the LTTng parsing library
The LTTng plug-in for Eclipse requires the installation of a third-party library, liblttngtrace, that is used to parse the binary LTTng traces. For the first Eclipse release, it was decided not to re-implemented that library in Java but to simply integrate it using JNI. As a consequence, you need to download, compile and install the parsing library.
This trace parsing library is not delivered as part of Eclipse (licensing stuff) and has to be downloaded from the LTTng site, compiled and then installed on your Linux system.
Currently, the Eclipse plug-in supports the following version of the LTTng trace format: 2.3, 2.5 and 2.6. Depending on which trace version(s) you wish to analyze, you will need to download the appropriate snapshot from the corresponding git repository (pick the "snapshot" link next to the latest commit):
Trace format 2.3
Trace format 2.5
Trace format 2.6
Build and install the snapshot(s) you downloaded. If you wish to install more than one version of the library, you will have to build them in format version sequence (e.g. build 2.6 last). For a plain library installation (in /usr/local/lib), you can execute the following commands for each version you wish to install:
$ cd liblttngtrace-2.n
$ ./autogen.sh --with-jni-interface --without-lttv && make
# make install
You will end up with something like this (the loader acts as a factory to pre-analyze the trace and load the correct parser library):
$ ls -l1 /usr/local/lib
total 1048
-rwxr-xr-x. 1 root root 210300 2010-06-07 11:24 liblttvtraceread-2.5.so
-rwxr-xr-x. 1 root root 211052 2010-06-07 11:25 liblttvtraceread-2.6.so
-rw-r--r--. 1 root root 316040 2010-06-07 11:25 liblttvtraceread.a
-rwxr-xr-x. 1 root root   1175 2010-06-07 11:25 liblttvtraceread.la
-rwxr-xr-x. 1 root root  93963 2010-06-07 11:24 liblttvtraceread_loader-2.5.so
-rwxr-xr-x. 1 root root  93963 2010-06-07 11:25 liblttvtraceread_loader-2.6.so
-rw-r--r--. 1 root root 125442 2010-06-07 11:25 liblttvtraceread_loader.a
-rwxr-xr-x. 1 root root   1224 2010-06-07 11:25 liblttvtraceread_loader.la
lrwxrwxrwx. 1 root root     30 2010-06-07 11:25 liblttvtraceread_loader.so -> liblttvtraceread_loader-2.6.so
lrwxrwxrwx. 1 root root     23 2010-06-07 11:25 liblttvtraceread.so -> liblttvtraceread-2.6.so
A number of configuration options are available to fine tune the library builds:
$ ./configure -- help
Usage: ./configure [OPTION]... [VAR=VALUE]...

To assign environment variables (e.g., CC, CFLAGS...), specify them as
VAR=VALUE.  See below for descriptions of some of the useful variables.

Defaults for the options are specified in brackets.

Configuration:
  -h, --help              display this help and exit
      --help=short        display options specific to this package
      --help=recursive    display the short help of all the included packages
  -V, --version           display version information and exit
  -q, --quiet, --silent   do not print `checking ...' messages
...
  <more options>
Finally, you have to set your LD_LIBRARY_PATH environment variable so Eclipse can find the parsing libraries. Otherwise, you have to specify the path when you start Eclipse:
$ LD_LIBRARY_PATH="/usr/local/lib:$LD_LIBRARY_PATH" ./eclipse
Downloading Sample Traces
To verify that your installation is functional, you can download sample traces from the Eclipse repository. The following LTTng traces are provided as samples.
Each trace as its own characteristics and complexity. The size given refers to the size of the trace once "untarred", the actual tar size should be ~10 times smaller.
- trace-15316 (456K) Very small trace (format 2.5 - 15316 events) made from a single LTTng marker. Recorded with a VirtualBox system with 1 processor.
- trace-15471 (460K) Very small trace (format 2.5 - 15471 events) made from a single LTTng marker. Recorded with a VirtualBox system with 1 processor.
(More sample traces to come)
Installation Verification
Here are the quick steps to verify that your installation is functional. If needed, refer to the #User Interface section for clarifications.
- Start Eclipse
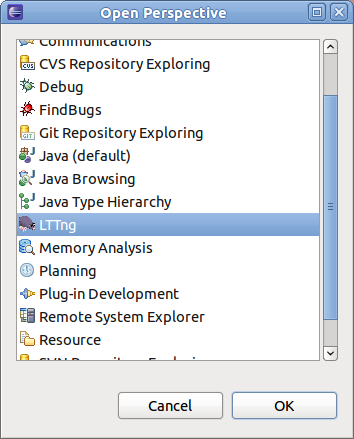
- Open the LTTng perspective
- Create an LTTng project
- Right-click in the Project view and select "New Project"
- Enter the name of your project (e.g. "MyLTTngProject")
- The project will be created. It will contain 2 empty folders: "Traces" and "Experiments"
- Import a sample trace
- Right-click on the newly created project and select "Import Trace"
- Navigate to the sample LTTng trace that you want to visualize
- Note: you have to drill down into the trace directory to import the trace correctly (yes, we know that the Import function needs to be re-written...)
- The newly imported trace should appear under the Traces folder
- Visualize the trace
- Expand the Traces folder
- Double-click on the trace
- The trace should load and the views be populated
Refer to #User Interface for detailed description of the views and their usage.
User Interface
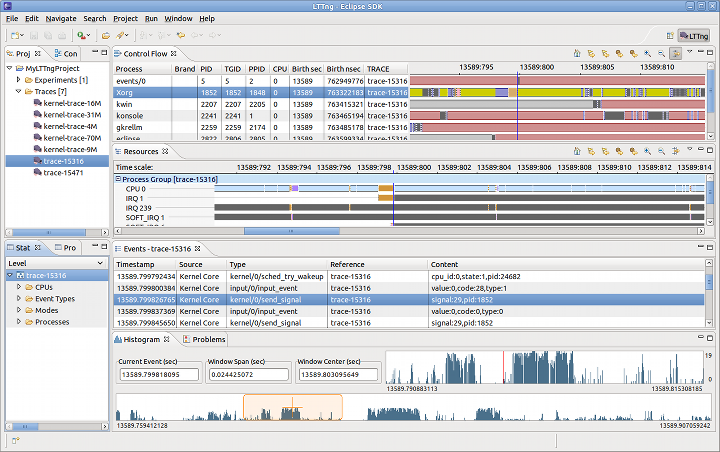
This section describes the LTTng perspective and its specific views.
LTTng Perspective
Project View
Events View
The Events View shows the basic trace data in chronological order in a tabular format.
The header displays the current trace (or experiment) name. The table displays the following fields:
- Timestamp: the event timestamp
- Source: the component that generated the event
- Type: the event type
- Reference: the trace that holds the event (e.g. experiments typically hold multiple traces)
- Content: the raw event content
The highlighted event is the current event and is synchronized with the other views. If you select another event, the other views will be synchronized accordingly.
Histogram View
Statistics View
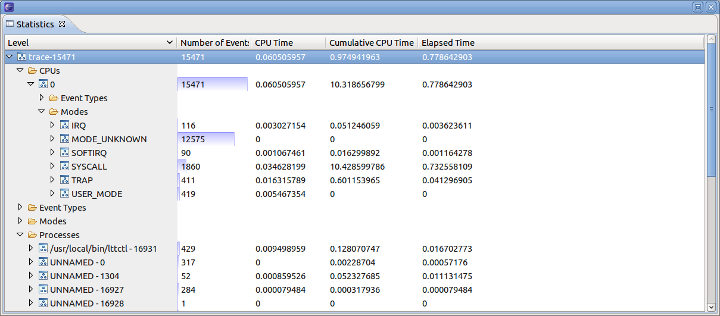
The Statistics View displays the various event counters that are collected when analyzing a trace. The data is organized per trace.
Control Flow View
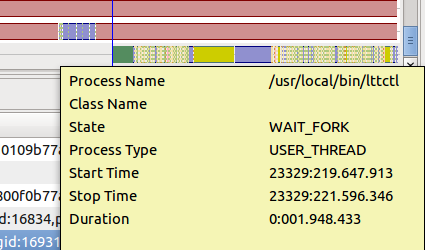
The Control Flow View is applicable to kernel trace data. It displays the list processes in tabular format, sorted by PID, as well as their state transitions over time in a Gantt chart format.
The tool bar options from left to right are:
- Home: reset the time window to the whole trace range.
- Next Event: sets the current event to the next event of the selected process.
- Previous Event: sets the current event to the previous event of the selected process.
- Next Process: sets the selected process to the next down in the list.
- Previous Process: sets the selected process to the next up in the list.
- Zoom In: zooms in the trace (i.e. shortens the current time window) at the current location. This can also be accomplished by using the mouse wheel in the graphical part.
- Zoom Out: zooms out the trace (i.e. widens the current time window) at the current location. This can also be accomplished by using the mouse wheel in the graphical part.
- Filter: display only the processes that have a state transition in the current window.
The process table displays the following fields:
- Process: the process name if know (UNNAMED otherwise)
- Brand:
- PID: the process ID
- TGID:
- PPID: the parent PID
- CPU: the CPU/core the process is running on
- Birth sec/nsec: the birth time of the process (0 if unknown) - seconds and nanoseconds
- TRACE: the name of the trace that holds this process
The graphical part shows the state of the corresponding process a la Gantt: the color represents the process state and the length of the bar represents the time span during which the process was in that state. The header corresponds to a time axis.
Note that depending on the scale or zooming factor, some pixels might represent more (in fact many, many more) than just one state.
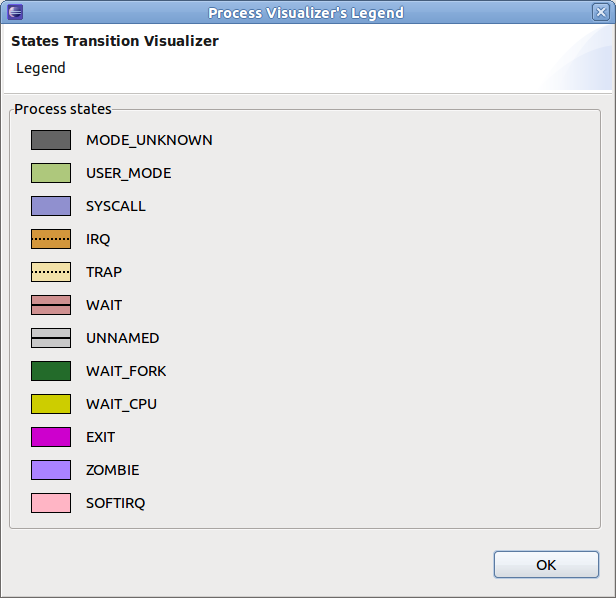
Here's a list of possible colors and their corresponding process state:
- MODE_UNKNOWN - Process state is unknown: there is not enough information in the trace to determine the state. This usually occurs for processes already alive when tracing started and the system is unable to infer the original state from the following trace events.
- USER_MODE - Running in user mode: the process is executing user source code or library calls (in user space).
- SYSCALL - Running in system call: the process is doing a system call to the kernel and the running mode switched from process limited rights to super user mode.
- IRQ - Servicing an IRQ: the currently running process is interrupted by an IRQ. As the IRQ does not change the currently running process (on some architectures it uses the same stack as the process), the IRQ state is shown in the state of the process. IRQ can be nested: a higher priority interrupt can interrupt a lower priority interrupt.
- TRAP - Running in a trap: the kernel is running a trap that services a fault. The most frequent trap is the memory page fault trap, called every time a page is missing from physical memory.
- WAIT - Waiting on I/O: the process is waiting for an I/O operation to complete before it can continue its execution.
- UNNAMED - Mode unnamed: see MODE_UNKNOWN
- WAIT_FORK - Waiting for fork: the process has just been created by its parent and is waiting for first scheduling.
- WAIT_CPU - Waiting for CPU: the process is ready to run but waiting to get the CPU (a schedule in event).
- EXIT - Process has exited: the process has exited, but still has the control of the CPU. It may happend if it has some tasks to do in the exit system call.
- ZOMBIE - Zombie process: the process in in zombie state. This state happens when a process exits and then waits for the parent to wait for it (wait() or waitpid()).
- SOFTIRQ - Running a soft IRQ handler: a SoftIRQ is normally triggered by an interrupt that whishes to have some work done very soon, but not "now". Doing the long part of a computation in a softirq that will be run just after the IRQ handler exits permits to do work while interrupts are enabled, without increasing the system latency.
Mouse Control
- Mouse Wheel
- Forward - Zoom In.
- Backward - Zoom Out.
- Mouse Drag
- States Area - Moves the time window in the direction of the drag keeping current scale.
- Time Scale Area - Changes the time scale to the time range from the start to the end of the drag action.
- Mouse Hover
- Hovering the mouse selection over a state will trigger a tooltip display with additional information, including the start and end times as well as the name of the state associated to the color.
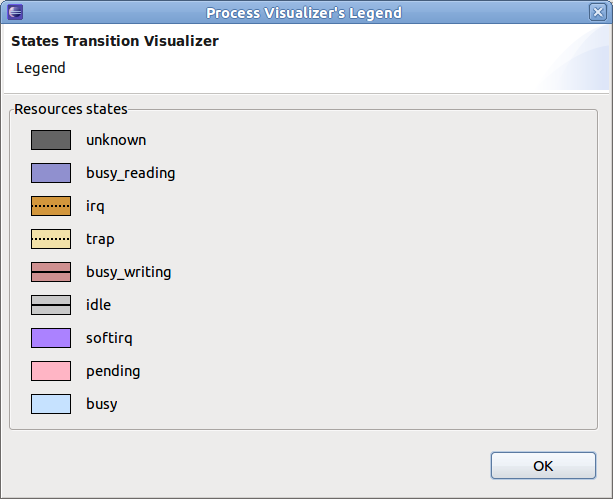
Resources View
The Resources View is applicable to kernel trace data. It displays the list system resources in tree format, grouped by trace, as well as their state transitions over time in a Gantt chart format.
The tool bar options from left to right are:
- Home: reset the time window to the whole trace range.
- Next Event: sets the current event to the next event of the selected process.
- Previous Event: sets the current event to the previous event of the selected process.
- Next Process: sets the selected process to the next down in the list.
- Previous Process: sets the selected process to the next up in the list.
- Zoom In: zooms in the trace (i.e. shortens the current time window) at the current location. This can also be accomplished by using the mouse wheel in the graphical part.
- Zoom Out: zooms out the trace (i.e. widens the current time window) at the current location. This can also be accomplished by using the mouse wheel in the graphical part.
- Filter: display only the processes that have a state transition in the current window.
The resource tree displays the system resources whose state transitions were collected in the trace.
The graphical part shows the state of the corresponding resources a la Gantt: the color represents the resource state and the length of the bar represents the time span during which the resource was in that state. The header corresponds to a time axis. Note that depending on the scale or zooming factor, some pixels might represent more (in fact many, many more) than just one state.
Here's a list of possible colors and their corresponding process state:
Mouse Control
Limitations
The current implementation is under heavy development and some important features are still missing. Here is a list of the known bugs and missing features that are being worked on.
Performance
The current version takes 3-5 more time to fully parse a trace than the finely optimized C version (LTTv). Things are event worse when the Statistics View is open. However, once a trace/experiment is selected, the user has immediate feedback and can start navigating and visualizing the trace while the parsing takes place in the background.
No tracer control
The LTTng tracer control (start/suspend/resume/stop tracing) is not integrated yet. Also, transferring an LTTng trace from a remote target is not supported yet.
64-bits and non-x86 host architectures
The parser libraries have not been extensively tested for 64-bits and not tested at all on non-x86 architectures. The code is believed to work on a broad range of architectures but this cannot be certified for now.
Searches and Filters
There is currently no way to filter events following some criteria or to dynamically sort the different fields.

