Notice: This Wiki is now read only and edits are no longer possible. Please see: https://gitlab.eclipse.org/eclipsefdn/helpdesk/-/wikis/Wiki-shutdown-plan for the plan.
Difference between revisions of "CDT/Obsolete/MultiCoreDebugWorkingGroup/calls/minutes"
(→Proposed topics) |
|||
| Line 35: | Line 35: | ||
* Scalability | * Scalability | ||
* Debugging virtual cores | * Debugging virtual cores | ||
| + | |||
| + | === Some of what was discussed === | ||
'''CoherentLogix demo''' | '''CoherentLogix demo''' | ||
| Line 46: | Line 48: | ||
* Uses the Properties view to show information about debug elements | * Uses the Properties view to show information about debug elements | ||
* They also use ZEST from some graph representation. | * They also use ZEST from some graph representation. | ||
| + | |||
| + | '''Visualization''' | ||
| + | * A lot of interest in the Visualizer view feature. | ||
| + | * CoherentLogix showed another Presentation | ||
'''Scope of debugger''' | '''Scope of debugger''' | ||
Revision as of 12:32, 24 March 2011
Contents
Previous Teleconferences Minutes of Meetings
March 23rd, 2011 - EclipseCon Workshop
Attendees
- Tim Cook (Coherent Logix)
- John Cortell (Freescale)
- Jesper Eskilson (IAR Systems)
- Mario Pierro (IAR Systems)
- Greg Watson (IBM)
- Al Rossi (NCSA)
- Bruce Griffith (Sage)
- Dobrin Alexiev (TI)
- Patrick Chuong (TI)
- Onur Akdemir (Tubitak)
- Ugur (Tubitak)
- Aaron Spear (VMWare)
- Pawel Piech (Windriver)
- Doug Schaefer (Windriver)
- Dominique Toupin (Ericsson)
- Marc Khouzam (Ericsson)
Proposed topics
- CoherentLogix demo
- Current status and what is coming (from GDB) soon
- What can be re-used/shared in PTP?
- Visualization/Visualizer feature
- Launching/Attaching
- What do we need from Debug Platform?
- Dealing with complexity in Eclipse
- What does the user really want? Features, usability, quality, ...?
- Changing connection paradigm e.g., using RSE (Target Management in general) from CDT
- Automatic discovery
- Scalability
- Debugging virtual cores
Some of what was discussed
CoherentLogix demo
- The HyperX IDE is CDT with DSF-GDB slightly modified. Does not use GDB but has a simulator that talks GDB/MI.
- Grid representation. Hard-coded similarly to Tilera. This would be a different Presentation for the Visualizer view.
- When launching, the view gets populated with the hard-code layout, but reads the position of tasks and routes from a backend. Task state is show by color (green, yellow, red).
- The Grid view can show multiple chips. This means there are multiple grid views within the main grid view.
- Colors from the Grid view are also used in the DV.
- Editor show with a green dots on the lines where breakpoints can be set. Setting breakpoint is not done for all cores, instead, they require a launch first and then the user selects the core and then the green dots show only for the code that runs on the chosen task. Existing bp show in the editor only when the right context is selected.
- They re-use the outline view to show different information based on some other select view.
- Uses the Properties view to show information about debug elements
- They also use ZEST from some graph representation.
Visualization
- A lot of interest in the Visualizer view feature.
- CoherentLogix showed another Presentation
Scope of debugger
- What should the CDT debugger address? We talked about how tracing needs to be used to isolate a problem when dealing with a large complex application. Once the problem is isolated, we then want to use traditional debugging. This debugging should allow to focus on multiple threads and cores.
Open-MP
- New directives that allow you to parallelize the code e.g., unrolling loops. How do we debug such a situation? For example, when setting a breakpoint, what does it mean.
Relative debugging
Scaling
Integrating Target-Management with Debugging
Kernel vs Application debugging
- Bare-metal, Jtag, Kernel and application debugging have different requirements.
Synchronization of two debug context providers
Target explorer view
- Provided by TCF and provides a nicer UI than the RSE 'remote systems' view.
- It has an editor showing all the processes on the target. The plan is to have a context-menu to attach the debugger. Because it already uses TCF services to the target, it is easy to use the TCF debugger service.
- Suggested feature was to drag-and-drop a process into the debug view to start debugging.
UI scripting
- TI has javascript using Rhino that allows you to use a command-line to control the UI. Open/close views and such things.
- It also allows to write scripts that can do complex things like create a new launch, fill the data, and launch the debugger.
- This can also be used as UI test automation.
Graphical representation of data structures
- Is there interest in showing data/data structures in a graphical fashion? Some companies already do this.
- The view detail pane can be used to show such things.
March 8th, 2011
Attendees
- Mikhail Khodjaiants (Mentor)
- Abeer Bagul(Tensilica)
- Shaiju Nair (Tensilica)
- Dobrin Alexiev (TI)
- Patrick Chuong (TI)
- Pawel Piech (Windriver
- Doug Schaefer (Windriver)
- Marc Khouzam (Ericsson)
API freeze
- Does not affect provisional/internal/experimental APIs
Global action set for "C/C++ Advanced Debugging"?
- Ultimately all new UI should be under its own actionSet
- ActionsSets should then be enabled/disabled automatically, when we figure out if they are of interest to the user
- Sometimes it is not possible to know that an actionSet should be enabled.
- We could create a perspective for 'multicore', although this may add confusion
- Need to allow to turn off pin&clone button visibility
- Currently capabilities can be used for products but are not so good for CDT itself
- Bug 246243 shows how to toggle buttons in view using the Command framework
- For Indigo, we'll have a global action set for the new 'multicore' features. It will need to be enabled manually. It should include Pin&Clone, Grouping and Multi-process (if necessary).
EclipseCon multicore debug workshop
- 1:20pm on Wednesday. Marc to email the list
Visualizer view
- Need an automated build
Grouping
- Feature does not affect existing functionality and can be kept off unless conciously enabled
- Patch waiting review
- Patch includes UI to group for DSF-GDB or DSF debuggers that implement the new service
Multi-process
- Multiple consoles (one per process) is supported
- Terminating individual processes is supported
- Will commit patch to stop showing the inferior in the debug view. This is the approach taken by EDC and TI's commercial product. We can revert if we don't like it.
- Need a way to allow the user to create a new process. Will add a button or entry in the Attach dialog; this is rudimentary as it does not allow for cutomization, but it will allow some users to try it out and exercise the code.
- Single process attach on windows no longer show list of processes for GDB < 7.0
Synchronized operations
- no progress, working on migration to DSF
Using multiple GDBs in a single launch
- Different options are possible
- Multiple DSF sessions. Probably need changes in the VM nodes
- Multiple commandControl service. Changes will be in the services
- Showing multiple models under the same launch
February 22, 2011
Attendees
- Norman Yee (Analog Devices)
- John Cortell (Freescale)
- Mikhail Khodjaiants (Mentor)
- Ken Ryall (Nokia)
- Bruce Griffith (Sage)
- Salvatore (ST Microelectronics)
- Abeer (Tensilica)
- Shaiju Nair (Tensilica)
- Dobrin Alexiev (TI)
- Patrick Chuong (TI)
- Bill Swanson (Tilera)
- Pawel Piech (Windriver
- Doug Schaefer (Windriver)
- Marc Khouzam (Ericsson)
Pin&Clone feature completed
- Now fully available in HEAD (including icon overlay)
- Available for Variables, Expressions, Registers, Memory Browser and Disassembly
- To add Pin&Clone to other views (e.g., not in open-source)
- Add the two buttons to the view using extension point
- When calling addDebugContextListener once must use the interface that uses the secondary id
Visualizer view
- Looking for a way to Headlessly build CDT
- LinuxTools seem to have a package to build called "eclipse-build"
- org.eclipse.cdt.releng/build.sh is used to build all of CDT, along with the PDE build
- Marc was not able to work on this due to other features that are planned for Indigo
Grouping
- Dobrin working on model to create groups
- The plan is to be able to group anything
- There will be an API to control what is allowed to be grouped for different debuggers
- Dobrin will post a new patch soon
Synchronized operations
- Shaiju currently working on migrating Tensilica debugger to DSF
- Bug 336788 available for comments
Multi-process
- Attaching to multiple processes in the same session is pertty much working with HEAD (GDB 7.2)
- Issue with context hierarchy for breakpoints where the breakpoint target does not contain the pid of the process when starting to track the breakpoints, but does contain the pid when we want to stop tracking bps, which makes the equality check fail. See Bug 336890
- What do we do about the inferior process?
- We need the inferior process for the IO console and to monitor the life of the process
- We don't necessarily need to show this process in the Debug View. Both EDC and TI have removed that entry.
- Another option is to create a group of inferiors in the DV if there is more than one inferior
- If we remove inferior, we can still show the proper console when selecting a process (container) instead of when selecting the inferior
- TI has a technique to remember if the user last used the IO or debugger console and show it accordingly
- Do we want to support Terminating a single process from Eclipse? If so, we also need to do it when selecting a container
- We could even remove the 'gdb' entry (not as useful since there is only one)
- Marc will prototype something to remove the inferior and see how it feels
- Console
- Have one console per process for IO
- Maybe have a global console for output (seems hard for input), but we may need to prefix each line of output, if that is possible
- Don't have a console for attach processes since their IO is not from eclipse
- Inferior that runs to completion, how to show in DV?
- When inferior dies we just stop showing it, like we do for threads that complete
Multicore debug workshop at EclipseCon
- Marc to email attendees off-line and suggest timeslots
Enhanced Breakpoint Support
- Patrick gave a very nice demo of TI's advanced breakpoint support, below are some of the things shown
- breakpoint per target
- unassigned bp can be added to targets after the target is started
- bp properties are provided by the backend
- XML file used to provide set of properties
- ability set all properties before creating the bp
- ability to create a bp is a disabled state
- uses flexible hierarchy and detail pane
- support for target actions
- support for extended host actions (e.g., enable group, show view)
- What are others doing? Should talk about it at the next meeting
- How do we include (some of) these features into open source? Which company can contribute some of their features?
February 8, 2011
Attendees
- Norman Yee (Analog Devices)
- Mikhail Khodjaiants (Mentor)
- Bruce Griffith (Sage)
- Shaiju (Tensilica)
- Dobrin Alexiev (TI)
- Patrick Chuong (TI)
- Bill Swanson (Tilera)
- Doug Schaefer (Windriver)
- Marc Khouzam (Ericsson)
Multicore debug workshop at EclipseCon
- We are interested in having a multi-core debug meeting at EclipseCon. Using a BOF is too open and too late at night. We should find a time during the day. We should book a room or maybe use the courtyard. Marc to email foundation for a room.
Visualizer view
- First part is to work on the framework and the first presentation
- To make it easy to use without CDT, we probably want new plugins
How to build CDT?
- Tensilica builds from sources
- Tilera looks for a repeatable, automatable way to build CDT
- org.eclipse.cdt.releng has scripts to build CDT, uses AntRunner
- Need a wiki to explain how to build CDT from sources. Questions should be posted to the list until we figure this out.
Grouping
- Dobrin moving code changes from DSF-GDB to DSF
- Need people to test: https://bugs.eclipse.org/240208
- Dobrin is making TI's debugger work with the proposed changes
- next step after that is to define the UI
- Need to clarify concepts like:
- backend-supported groups
- frontend-only groups
- recursive grouping
- Need to investigate other commands than run-control that can affect groups such a 'load'
- Shaiju can try out the patch and provide feedback
- Mikhail will also try to get some time
- GDB will be doing some work on grouping and we should make sure it fits with what we need
Synchronized operations
- Post on the wiki on what Tensilica is doing: What Tensilica is currently providing.
- Need to get input from the community to get all requirements
- Builds on top of the grouping feature
- Tensilica does not use groups, but uses an all-or-nothing grouping approach
- Need a bugzilla for this effort, Shaiju opened https://bugs.eclipse.org/bugs/show_bug.cgi?id=336788
- http://bugs.eclipse.org/330974 for "live" grouping using multi-select
Multi-process UI
- UI has to be defined
- Marc almost done with plumbing for DSF-GDB using GDB 7.2
Pin&Clone
- Part of M2 build
- Coloring available in http://bugs.eclipse.org/334566
- Patrick almost done with patch for coloring
Enhanced Breakpoint Support
- TI has a better bp support using flexible hierarchy
- TI deals with breakpoint properties as provided by the backend
- TI creating breakpoints allow to set conditions and properties before creating the bp
- Demo next meeting of TI bp support
- Need to collect requirements
- consolidate things to one location
- creation with full properties before setting bp
- get info from backend
Next conference call will be in two weeks on Februrary the 22nd
January 25, 2011
Attendees
- Norman Yee (Analog Devices)
- Mikhail Khodjaiants (CodeSourcery)
- Aaron Spear (Mentor Graphics)
- Ken Ryall (Nokia)
- Shaiju (Tensilica)
- Dobrin Alexiev (TI)
- Patrick Chuong (TI)
- Bill Swanson (Tilera)
- Pawel Piech (Windriver)
- Doug Schaefer (Windriver)
- Marc Khouzam (Ericsson)
Next conference call will be in two weeks on Februrary the 8th
Synchronized/Grouped Run Control Operations (Synchronous operations)
- A synchronous the operation is an operation that makes all elements in a group run in "lock-step" and stop at exactly the same time.
- A group leader is needed when doing a true sync operation to know when the operation is finished. For example a group of core 1, 2 and 3 can be requested to step with leader being core 2; the operation will step each core at the same time and will stop all three at exactly the point where core 2 (the leader) will finish its step
- Both Mentor and Ericsson use synchronous operations
- TI 'simulates' a sync operation in their backend by doing a tight async operation that is actually a full step of each element of the group, but that is done at the same time
- GDB has limited support for this kind of operation. The --all flag can be used and the scheduler-locking feature can help.
- Tensilica do a loop in the frontend to do individual steps for each group member.
- Tilera allows elements of the group to perform the operation only if the leader does not stop right away. The idea is to allow the user to focus on the process that has a problem. This is like all-stop except that when stepping the one process, the others should not move at all, or at least not until the current process progresses enough. "Why resume all the processes if they will be stopped again almost immediately because the main process has hit a breakpoint again".
- The eclipse support for this type of operation must be based on backend capabilities because different backend can support this in different ways. This can be achieved by having the DSF services perform the operation in the way their backend supports
- Some backend may support may of the synch/asynch/hybrid operations. Do we provide the user with a choice of what type of operation should be used?
- There seems to be high interest for such support in Eclipse so we suggest getting this effort started.
- Shaiju from Tensilica will try to get time allocated to work on this.
Global breakpoints
- Feature coming to GDB where a breakpoint can be set in a binary without specifying which process should be stopped. Any process hitting the breakpoint will be stopped and the debugger will attach to it.
- Which set of process does this global breakpoint apply to? All processes, a subset, current and new processes, etc. GDB will have support for such a configuration
- For Eclipse, using Global Breakpoint will greatly benefit from the task we identified and called "Enhanced breakpoint support"
Enhanced breakpoint support
- WindRiver would like to merge their breakpoint support with CDT. No timeline for it though. Who from WindRiver could be involved?
- There is high interest in the community and from different companies. We need to identify someone to lead this effort
Common changes
- Pawel agreed that changes that are to be used by multiple DSF debuggers can be put in DSF as long as backward compatibility is respected
- If he cannot find time to review such patches, they will need to be handled by other DSF commmitters
Visualizer view
- Bill posted a proposal and opened http://bugs.eclipse.org/335027
- Mikhail, Dobrin and Marc have already reviewed the document and will post comments to the bug. Others in the community are encouraged to do the same.
- Need more use-cases for harware types to be added the document
- If needed, we could have a separate conf call to address some question about this proposal
- Can we use GEF (Graphical Editing Framework) of Eclipse to help with the different 'Presentations' for this view?
- The framework would not use GEF, but the presentations could.
- Would PTP benefit of this framework? We should involve them, maybe at EclipseCon11
- This framework/view should be in its own plugins
Pin&Clone
- Feature available in CDT with an example in DSF-GDB. Can apply easily to DSF and non-DSF debuggers.
- Icons for pinning are still waiting to be committed
Grouping
- Multi-level hierarchy: Patch is ready but needs more testing
- Next step is to implement the grouping/hiding actions
December 14, 2010
Attendees
- Mikhail Khodjaiants (CodeSourcery)
- Stan Shebs (CodeSourcery)
- John Cortell (Freescale)
- Chris Recoskie (IBM)
- Aaron Spear (Mentor Graphics)
- Ken Ryall (Nokia)
- Shaiju (Tensilica)
- Dobrin Alexiev (TI)
- Patrick Chuong (TI)
- Bill Swanson (Tilera)
- Pawel Piech (Windriver)
- Doug Schaefer (Windriver)
- Onur Akdemir
- Marc Khouzam (Ericsson)
- Dominique Toupin (Ericsson)
Minutes
What about the Multi-core association working group?
- Chaired by Aaron Spear from Mentor
- Current focus is on Tracing
- Interest in Debug as well but wider than Eclipse
- Good for such things as protocols, synchronization between different debuggers, etc
Things for Indigo
- Pin & Clone (Patrick)
- Grouping & Hiding & Commands on containers (Dobrin)
- Multi-process (Marc)
- Start of Visualizer view effort (Bill, Marc, group)
Visualizer view
- Need to start to discuss what this view should do to make sure it addresses what we need.
- Bill will start a wiki to put up ideas and suggestions, like the kind of environment, the types of visualization
- Marc to open bugzilla for visualizer view discussion
- We will need a good framework to provide a way to do the visualization
- Visualizer view will need to handle multiple targets/launches. It should switch the type of display as the user chooses a different launch.
- Sub tasks
- We may need to move the run control buttons to the main toolbar to be able to have different views use them. Or should we have them in each of the driving views? Do we need a bug to track this? Patrick can prototype this.
- Need to have platform support the concept of the Debug View set its selection based on another view that is a debug context provider. Need some service to translate the debug context of one view into something consumable by other views.
Breakpoint management for 'multi-core' targets
- Current CDT breakpoint support is very limited
- We need to create a breakpoint for a specific target/core/process/thread
- There is support for thread-specific, but only after creation
- Freescale has a mode that restricts the breakpoints creation to the active context, if this option is chosen by the user
- Breakpoints view should somehow show quickly where a breakpoints is installed
- Maybe the visualizer view could also be used to show breakpoint with respects to cores/processes/threads
- TI uses breakpoint grouping and filtering in the Breakpoints view to improve the situation
- TI applies breakpoints to the current multi-selection of the Debug view to control where they are set, that info is then stored in breakpoint attributes for re-creation
- We need a unified solutions for enhanced breakpoint support
Status
- Pin&Clone
- Support is now part of platform
- Patch posted for CDT for the different debug views. Feedback would be good. Patch can be found in Bug 331781
- Grouping and Hiding
- Limited progress. Patch for discussion should be posted this week. Bug 240208
- Multi-process
- Demo of DSF-GDB status
- With GDB 7.2 and the patch posted at Bug 237306, we can freely start multiple processes and attach to multiple running processes in the same debug session.
- The UI workflow is unclear. How do we specify the details for each new process to be started?
- It would be nice to use a view of all processes and double-click on one to attach
- RSE target view could be used for this as well, but that would be outside CDT
- Demo of EDC
- It uses different launches but shows them under the same top-level node in the Debug view
- The top-level node is the target
- When a new launch is run for the same target, it is automatically shown under the same top-level node
- A new launch to the same target automatically re-uses the same connection to the target
- Allows to have full settings for each process through a launch UI since it is a fully launch
- Launches persists settings so they can be re-used
- To avoid the heaviness of launches, the user usually won't use the launch UI but will use quick buttons and double-clicks that will trigger the launch automatically. The launch UI remains available for advanced cases of configuration. But underneath it all, each process is a different launch.
- Source lookup was enhanced to allow the user to choose a launch's individual source lookup info, or the superset of all common-launches source lookup info.
- Demo of DSF-GDB status
Other
- What about filtering of the debug view? This should be achievable once we have general Grouping and Hiding feature.
- There is interest in a Global Breakpoints feature that will allow to set a breakpoint in a piece of code, without specifying which process/core/thread. This feature will be available from GDB using a Linux Kernel module, sometime next year.
November 30, 2010
Attendees
- Norman Yi (Analog Devices)
- Mikhail Khodjaiants (CodeSourcery)
- Stan Shebs (CodeSourcery)
- John Cortell (Freescale)
- Chris Recoskie (IBM)
- Abeer Bagul (Tensilica)
- Anand Bhange (Tensilica)
- Pete Macliesh (Tensilica)
- Shaijup (Tensilica)
- Dobrin Alexiev (TI)
- Patrick Chuong (TI)
- Bill Swanson (Tilera)
- Randy Rohrbach (Windriver)
- Doug Schaefer (Windriver)
- Marc Khouzam (Ericsson)
- Dominique Toupin (Ericsson)
Minutes
Tilera's Grid view demo (Bill)
- Bill showed Tilera's development environment, focusing on the Grid view.
- There is a Monitor view which presents somewhat of a summary of the information of the DebugView
- The DV uses the standard layout of Launch->process->threads->stack frames
- Grid view
-
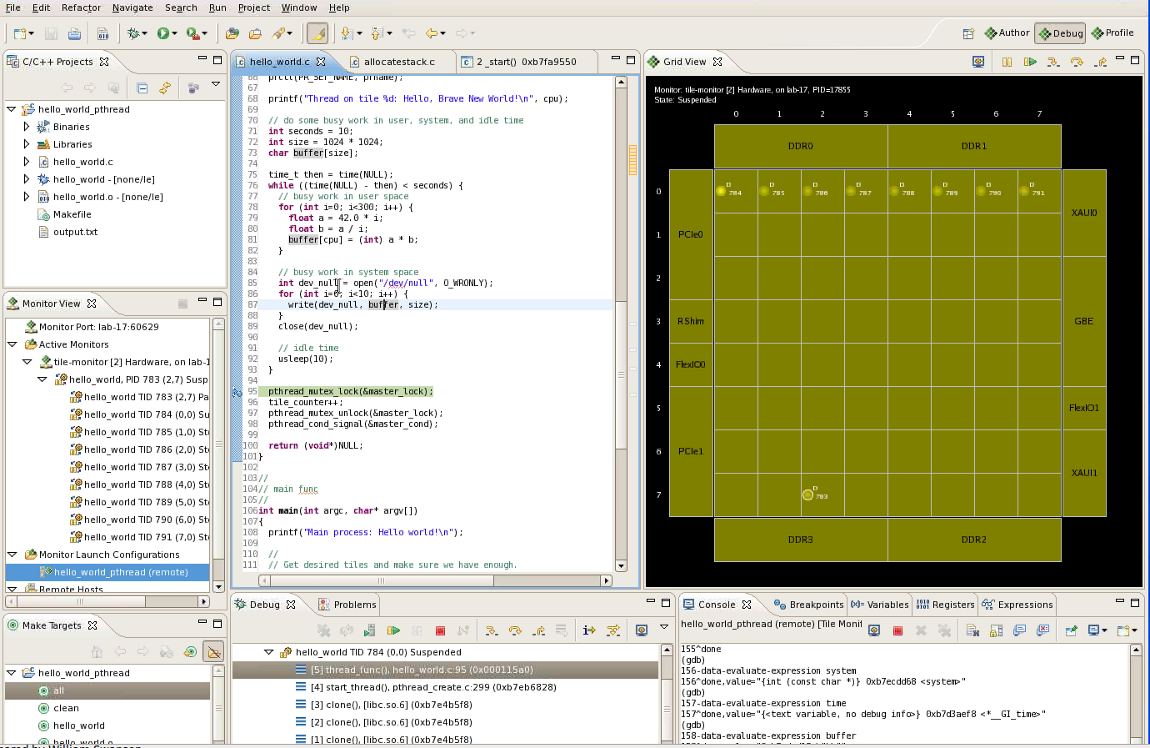
- Threads are shown in the grid view based on their location on the hardware
- Selecting a thread in the Grid view will change the active selection of the DV
- In fact, the Grid view and the DV are kept in sync at all times. This implies also that a selection change in the DV will update the selection in the Grid view.
- The synchronization of the DV with the Grid view for the active debug context is done by faking selection events (deltas).
- It is possible to select a range within the Grid view using the mouse. The active context of the DV will be chosen arbitrarily within the selected range.
- View provides Resume/Step/Suspend buttons that apply to the active context, as is done in the DV.
- Hovering over the Grid view provides information about the threads and hardware.
- To avoid having threads move around much too fast in the view, it only reports changes when a thread actually stays in the same location for a certain minimum amount of time. This is done by a 'tile monitor' process that sits between Eclipse and the target.
-
- It was mentioned that using the DebugSelectionProvider and DebugSelectionListner API of the platform should allow us to keep the synchronization between two views providing the active context at the same time,
- We need to confirm that the platform properly supports having multiple selectionProviders at the same time.
- It would be good to get a small prototype with 2 or 3 active selectionProviders including the DV
- Is the DV already a selectionListener? It is believed so, but should be verified
- Is there a impact to the Pin&Clone feature from having multiple selectionProviders?
- One suggestion put forth was to have a feature to allow to select a variable and to show its content on the Grid view
- Tilera is interested in having a view like the Grid view in open-source
- Bill explained that the main issues with contributing the Grid view to open-source, is that the current implementation is not generic. We would need an generic API to allow for different layout for such a view
- There was interest from almost everyone in the call in getting this view part of open-source. Some people may be able to directly help.
- There were still questions about how PTP handles such a view since they have something similar, but no one from PTP was on the call
- There was a concern about potential existing patents on the Tilera's Grid view. We need to confirm that no such thing would prevent us from implementing this type of view, before actually starting the work.

Pin&Clone feature
- Patrick gave a demo of the Pin&Clone feature as proposed right now. The lable/icon indicator was not working because of a recent change requested by the platform.
- Pin&Clone also supports a multi-selection pinning. This means that a view pinned to more than one context, would change when the active context changes to any of the context part of its pin set.
- Pinning will also work for 'groups' once such a concept is implemented
- The main use-case of this feature is to compare data of different contexts, and keep comparing as execution progresses
- Depending on the situation, the context to be pinned to may be a parent of the one that is currently active. Ultimately, for CDT, the decision of which context in the hierarchy should be the one used for pinning, should be a backend decision (for DSF, it should be the services making that decision)
- It is unclear how to store the pinned context so that it can be found again for a new debugging session.
- The patch for the platform is close to being approved (it was actualy committed the day after the meeting!)
- Once the platforms allows for the pin&clone feature, we can implement it in CDT. There was a concern that it may be too advanced for some users; it was suggested to use an ActionSet or a Preference to enable the feature
Grouping Demo
- Dobrin gave a nice demo (similar to the one given at the CDT summit) to show the grouping/hiding feature that he is trying to contribute to CDT
- There would be a way to group/ungroup/hide any part of the context hierarchy
- Operations can be performed on a group (resume/step/suspend)
- The concept of groups does not need to be supported by the backend. In such a situation, the backend services would loop over all element of the group to perform the operation
- Dobrin also showed how TI uses the launch to allow the user to select which types of nodes are going to be shown in the DV
Other
- Stan Shebs, one of the GDB maintainers, mentioned that there is interest from GDB to support "multi-core" debugging
- With that in mind, he asked that if people ran across scalability limitations in GDB itself, we should report them to the GDB mailing list (gdb@sourceware.org). This will enable the GDB community to address those issues, which will surely eventually affect eclipse when using GDB.
- One the topic of scalability, it was mentioned that the Expressions view is not very efficient; every expression is queried not matter what the context is, an in many cases the expressions don't apply to the current context.
November 16, 2010
Attendees
- Norman Yi (Analog Devices)
- John Cortell (Freescale)
- Abeer Bagul (Tensilica)
- Anand Bhange (Tensilica)
- Pete Macliesh (Tensilica)
- Patrick Chuong (TI)
- Dobrin Alexiev (TI)
- Bill Swanson (Tilera)
- Pawel Piech (WindRiver)
- Doug Schaefer (WindRiver)
- Marc Khouzam (Ericsson)
- Dominique Toupin (Ericsson)
Minutes
- Level of expected contributions from interested parties
- Patrick and Dobrin have time allocated to this
- Marc has time allocated for this
- Pete can have someone help on UI work
- Other commitments will clarify as the effort takes shape
- Conference calls
- We will continue with this time slot (11am Ottawa time) every two weeks or so. We will adjust the frequency depending on the progress.
- Current status
- TI (Patrick and Dobrin) are working on open-sourcing some of their multi-core features
- Pin & Clone effort (Patrick)
- He has posted a small patch for platform which would allow other projects (e.g., CDT) to implement Pin and Clone. He is waiting for the platform team to review the patch in detail.
- Patrick was ready to give a demo but we ran out of time. We will have the demo at the next conference call.
- After the demo, we can start discussing and potentially bringing to the cdt-dev list the question of having this feature committed to CDT (pending the approval of the small platform patch)
- Worked tracked in Bug 327263. Anyone can try out the feature as follows:
- Checkout the platform org.eclipse.debug and org.eclipse.debug.ui plugins
- Apply the latest patch available in Bug 327263
- Save the test plugin also attached to Bug 327263, and import it into your workspace.
- Start cloning and pinning debug views using the new buttons added to each view!
- Recursive set of container context in DSF/DSF-GDB (Dobrin)
- The approach is to use the Debug View with a recursive set of containers, where the backend debugger remains the top-level entity.
- Worked tracked in Bug 240208
- Issues with deltas when enabling recursive containers
- Does anyone have a use-case where a container would also have a stack frame under it? Currently no, so we won't pursue this at this time.
- Dobrin will demo his progress at the next conference call
- TI's uses cases all focus on 10 to 50 contexts in the debug view. They currently feel that dealing with more than 100 contexts requires a new approach.
- Pin & Clone effort (Patrick)
- TI (Patrick and Dobrin) are working on open-sourcing some of their multi-core features
- Discussions on Tilera's Grid view:
- The view has proven useful, but mostly when knowledge about the underlying hardware was relevant to the problem being debugged.
- Tilera saw that software designers still view their software as a generic grouping of processes and threads, as shown in the Debug View.
- Different users approach different problems in different ways. We should give users different views, etc, to tackle problems and let them choose what suits their needs.
- Concerns were voiced about having two selection providers (Debug View and Grid view), but Bill confirmed he was able to get it to work. A demo will be given at the next call.
- Someone asked if PTP had to deal with multiple selection providers for their views. We did not know the answer to this.
- Filtering of information is essential to multi-core debugging. Grouping and hiding are trying to address this.
- Clean up wiki page to help people add their use-cases of interest, to help keep focus on the problems we face. [Marc]
- Code Reviews would be valuable. With people actively working on this effort, we could code review each others work.
- We will need to allocate time to do proper documentation for the features we will implement in this effort.