Notice: This Wiki is now read only and edits are no longer possible. Please see: https://gitlab.eclipse.org/eclipsefdn/helpdesk/-/wikis/Wiki-shutdown-plan for the plan.
Difference between revisions of "Linux Tools Project/LTTng2/User Guide"
(→Statistics) |
|||
| Line 37: | Line 37: | ||
== Histogram == | == Histogram == | ||
== Statistics == | == Statistics == | ||
| + | |||
| + | The Statistics View displays the various event counters that are collected when analyzing a trace. The data is organized per trace. To open the Statistics View, select Windows -> Show View -> Other... -> Tracing -> Statistics. A new view will open with the name Statistics. This view shows 2 columns Level and Number of Events. After parsing a trace the view will display the number of events per event type. The cell where the number of events are printed also contain a coloured bar that indicates the percentage of the event count in relation to the total number of events. The statistics ic collected for the whole trace. This view is part of the Tracing and Monitoring Framework (TMF) and is generic. It will show statistics all trace type extensions. For the LTTng 2.0 integration the Statistics view will display statistics as shown below.: | ||
| + | |||
== Control == | == Control == | ||
Revision as of 15:13, 7 June 2012
{{#eclipseproject:technology.linux-distros}}
| Linux Tools | |
| Website | |
| Download | |
| Community | |
| Mailing List • Forums • IRC • mattermost | |
| Issues | |
| Open • Help Wanted • Bug Day | |
| Contribute | |
| Browse Source |
Contents
- 1 Introduction
- 2 Installation
- 3 LTTng
- 3.1 Tracing
- 3.2 Project
- 3.3 Events
- 3.4 Histogram
- 3.5 Statistics
- 3.6 Control
- 3.6.1 Control View
- 3.6.1.1 Creating a New Connection to a Remote Host
- 3.6.1.2 Disconnecting from a Remote Host
- 3.6.1.3 Connecting to a Remote Host
- 3.6.1.4 Deleting to a Remote Host Connection
- 3.6.1.5 Creating a Tracing Session
- 3.6.1.6 Enabling Channels - General
- 3.6.1.7 Enabling Channels On Session Level
- 3.6.1.8 Enabling Channels On Domain Level
- 3.6.1.9 Enabling and Disabling Channels
- 3.6.1.10 Enabling Events - General
- 3.6.1.11 Enabling Kernel Events On Session Level
- 3.6.1.12 Enabling UST Events On Session Level
- 3.6.1.13 Enabling Events On Domain Level
- 3.6.1.14 Enabling Events On Channel Level
- 3.6.1.15 Enabling and Disabling Events
- 3.6.1.16 Enabling Tracepoint Events From Provider
- 3.6.1.17 Adding Contexts to Channels and Events of a Domain
- 3.6.1.18 Adding Contexts to All Events of a Channel
- 3.6.1.19 Adding Contexts to a Event of a Specific Channel
- 3.6.1.20 Start Tracing
- 3.6.1.21 Stop Tracing
- 3.6.1.22 Destroying a Tracing Session
- 3.6.1.23 Refreshing the Node Information
- 3.6.1.24 Quantifing LTTng overhead (Calibrate)
- 3.6.1.25 Importing Session Traces to a Tracing Project
- 3.6.2 Properties View
- 3.6.3 LTTng Trace Control Preferences
- 3.6.1 Control View
- 3.7 Environment Variables
- 3.8 Colors
- 3.9 Filter
- 4 LTTng Kernel Analysis
- 5 Limitations
- 6 References
Introduction
About Tracing
- What is it - LTTng
Common Trace Format
LTTng integration
Control of the LTTng tracer
- ssh
Visualization of LTTng traces
Features
- Performance
 - Large trace handling
    - Zooming
    - Persisted State System
- Events Searching, Filtering, Highlighting, Bookmarking - Trace analysis tools - Synchronized views - Custom Parsers (text + XML)
Installation
LTTng tracer
LTTng Eclipse Integration
- Dependencies (RSE)
Features and Plug-ins organization
CTF Parser
TMF
LTTng
LTTng Kernel
LTTng
Tracing
Project
Events
Histogram
Statistics
The Statistics View displays the various event counters that are collected when analyzing a trace. The data is organized per trace. To open the Statistics View, select Windows -> Show View -> Other... -> Tracing -> Statistics. A new view will open with the name Statistics. This view shows 2 columns Level and Number of Events. After parsing a trace the view will display the number of events per event type. The cell where the number of events are printed also contain a coloured bar that indicates the percentage of the event count in relation to the total number of events. The statistics ic collected for the whole trace. This view is part of the Tracing and Monitoring Framework (TMF) and is generic. It will show statistics all trace type extensions. For the LTTng 2.0 integration the Statistics view will display statistics as shown below.:
Control
The LTTng Tracer Control in Eclipse for the LTTng Tracer toolchain version v2.0 (or later) is done using SSH and requires an SSH server to be running on the remote host. For the SSH connection the SSH implementation of RSE is used. For that a new System Type was defined using the corressponding RSE extension. The functions to control the LTTng tracer (e.g. start and stop), either locally or remotely, are available from a dedicated Control View.
In the following sections the LTTng 2.0 tracer control integration in Eclipse is described. Please refer to the LTTng 2.0 tracer control command line manual for more details and descriptions about all commands and their command line parameters References.
Control View
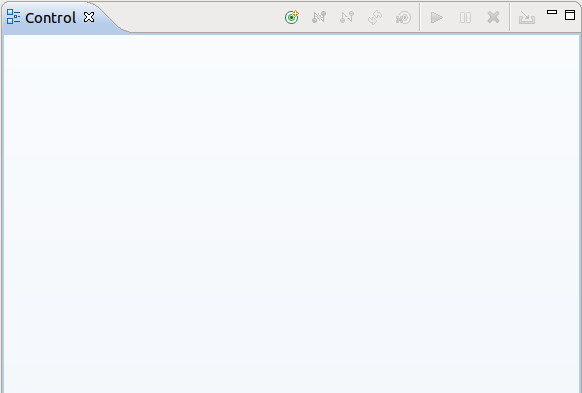
To open the Control View, select 'Window->Show View->Other...->LTTng->Control View.
Creating a New Connection to a Remote Host
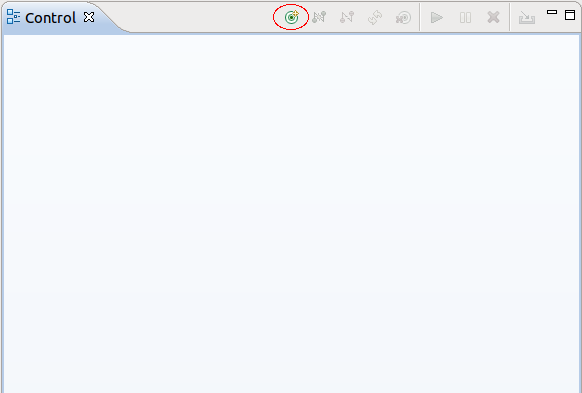
To connect to a remote host, select the New Connection button in the Control View.
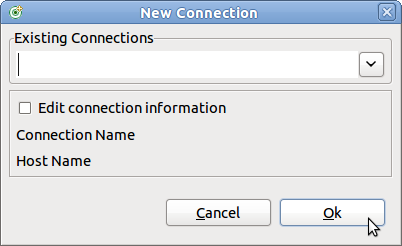
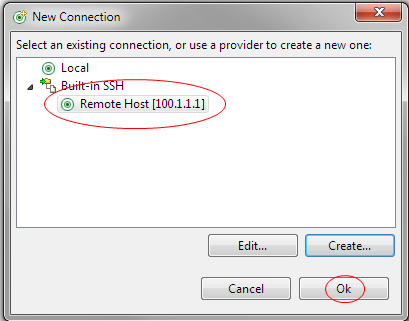
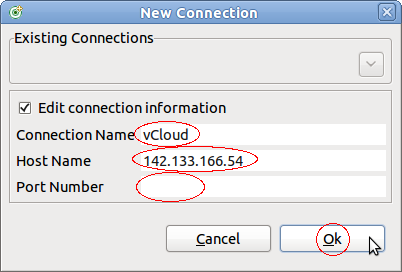
A new display will show for entering the remote host information. A drop down menu will filled with all existing host information which were used before. To enter the host information either select one of the hosts in the drop down menu or enter the host information manually.
To use an existing connection definition, select the relevant entry in the drop-down menu and then select Ok.
To enter the host information manually select first the button Edit connection information. Then the text fields Connection Name and Host Name will enabled. Enter the relevant information and then select Ok.
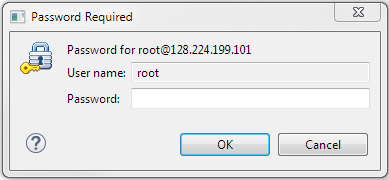
A new display will show for providing the user name and password. This display only opens if no password had been saved before. Enter user name and password in the Enter Password dialog box and select Ok.
The Host Name holds the IP address or DNS name of the remote system. The Connection Name is the alias name to be displayed in the Control View.
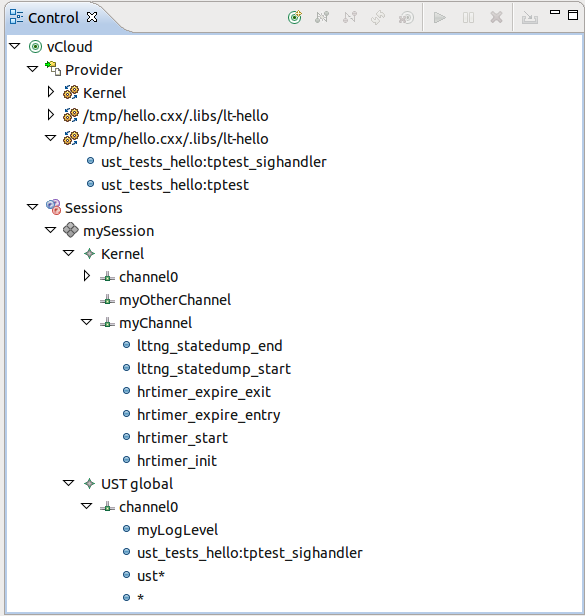
After pressing Ok the SSH connection will be established and after successful login the Control View implementation retrieves the LTTng Tracer Control information. This information will be displayed in the Control View in form of a tree structure.
The top level tree node is the representation of the remote connection (host). The connection name of the connection will be displayed. Depending on the connection state different icons are displayed. If the node is CONNECTED the icon is shown ![]() , otherwise (states CONNECTING, DISCONNNECTING or DISCONNECTED the icon is
, otherwise (states CONNECTING, DISCONNNECTING or DISCONNECTED the icon is ![]() .
.
Under the host level two folder groups are located. The first one is the Provider group. The second one is the Sessions group.
Under the Provider group all trace providers are displayed. Trace providers are Kernel and any user space application that supports UST tracing. Under each provider a corresponding list of events are displayed.
Under the Sessions group all current sessions will be shown. The level under the sessions show the configured domains. Currently the LTTng 2.0 Tracer Toolchan supports domain Kernel and UST global. Under each domain the configured channels will be displayed. The last level is under the channels where the configured events are displayed.
Each session can be ACTIVE or INACTIVE. Active means that tracing has been started, inactive means that the tracing has been stopped. Depending on the state of a session a different icon is displayed. The icon for an active session is ![]() . The icon for an inactive session is
. The icon for an inactive session is ![]() .
.
Each channel can be ENABLED or DISABLED. An enabled channel means that all configured events of that channel will be traced and a disabled channel won't trace any of its configured events. Different icons are displayed depending on the state of the channel. The icon for an enabled channel is ![]() and the icon for a disabled channel is
and the icon for a disabled channel is ![]() .
.
Events within a channel can be in state ENABLED or DISABLED. Enabled events are stored in the trace when passed during program execution. Disabled events on the other hand won't be traced. Depending on the state of the event the icons for the event is different. An enabled event has the icon ![]() and a disabled event the icon
and a disabled event the icon ![]() .
.
Disconnecting from a Remote Host
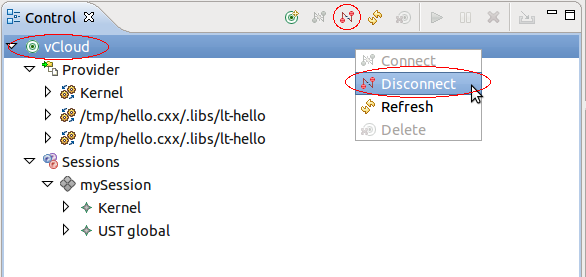
To disconnect from a remote host, select the host in the Control View and press the Disconnect button. Alternatively, press the right mouse button. A context-sensitive menu will show. Select the Disconnect button.
Connecting to a Remote Host
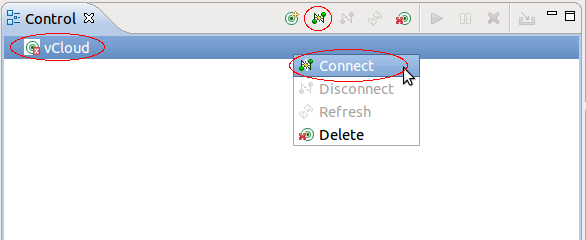
To connect to a remote host, select the host in the Control View and press the Connect button. Alternatively, press the right mouse button. A context-sensitive menu will show. Select the Connect button. This will start the connection process as discribed in Creating a New Connection to a Remote Host.
Deleting to a Remote Host Connection
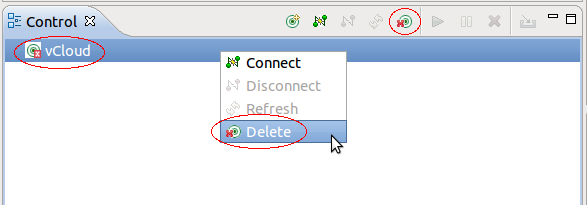
To delete a remote host connection, select the host in the Control View and press the Delete button. Alternatively, press the right mouse button. A context-sensitive menu will show. Select the Delete button. For that command to be active the connection state has to be DISCONNECTED.
Creating a Tracing Session
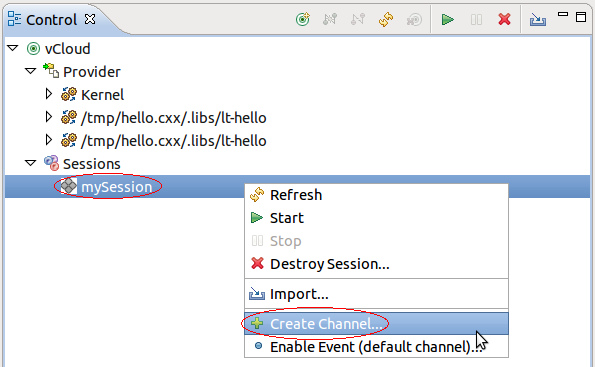
To create a tracing session, select the tree node Sessions and press the right mouse button. Then select the Create Session... button of the context-sensitive menu.
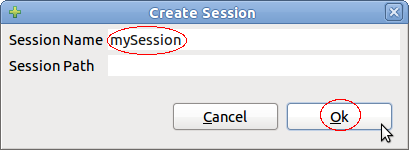
A dialog box will open for entering information about the session to be created.
Fill in the Session Name and optionally the Session Path and press Ok. Upon successful operation a new session will be created and added under the tree node Sessions.
Enabling Channels - General
Enabling channels can be done using a session tree node when the domain hasn't be created in the session or, alternatively on a domain tree node of a session in case the domain is already available.
Enabling Channels On Session Level
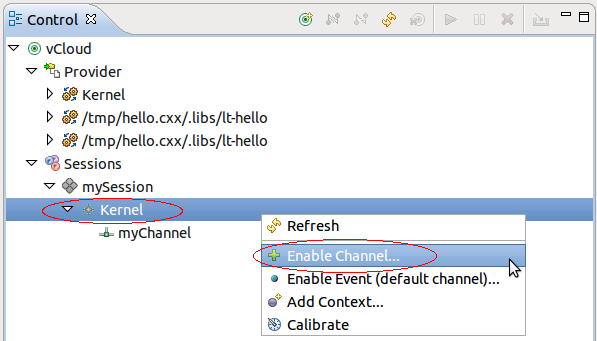
To enable a channel, select the tree node of the relevant session and press the right mouse button. Then select the Enable Channel... button of the context-sensitive menu.
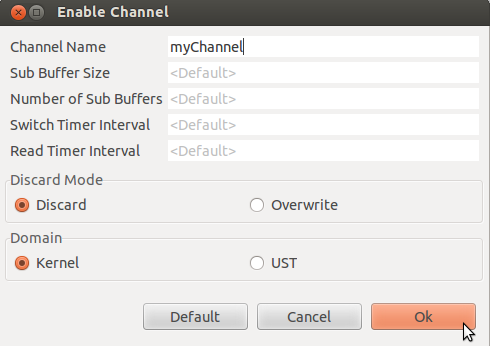
A dialog box will open for entering information about the channel to be created.
By default the domain Kernel is selected and the corresponding default values are shown. To create a UST channel, select UST under the domain section. To get the default values of UST, then press button Default.
If required update the following channel information and then press Ok.
- Channel Name: The name of the channel.
- Number of Sub Buffers: The number of sub-buffers of the channel.
- Overwrite Mode: The channel overwrite mode (true or false)
- Read Timer Interval: The read timer interval.
- Sub Buffer size: The size of the sub-buffers of the channel (in bytes).
- Switch Timer Interval: The switch timer interval.
Upon successful operation, the requested domain will be created under the session tree node as well as the requested channel will be added under the domain. The channel will be ENABLED.
Enabling Channels On Domain Level
Once a domain is available, channels can be enabled directly using the domain. To enable a channel under an existing domain, select the tree node of the relevant domain and press the right mouse button. Then select the Enable Channel... button of the context-sensitive menu.
The dialog box for enabling channel will open for entering information about the channel to be created. Note that the domain is pre-selected and cannot be changed.
Fill the relevant information and press Ok.
Enabling and Disabling Channels
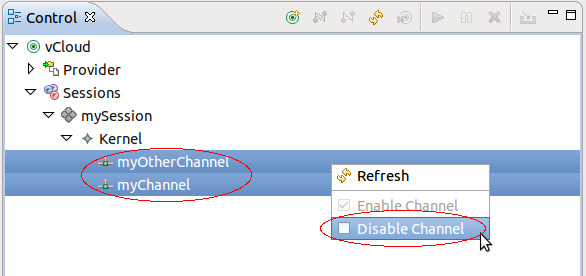
To disable one or more enabled channels, select the tree nodes of the relevant channels and press the right mouse button. Then select the Disable Channel menu item of the context-sensitive menu.
Upon successsful operation, the selected channels will be DISABLED and the icons for the channels will be updated.
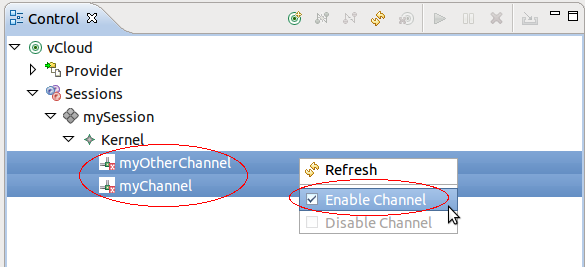
To enable one or more disabled channels, select the tree nodes of the relevant channels and press the right mouse button. Then select the Enable Channel menu item of the context-sensitive menu.
Upon successsful operation, the selected channels will be ENABLED and the icons for the channels will be updated.
Enabling Events - General
Enabling events can be done using different levels in the tree node. It can be done on the session, domain level and channel level. For the case of session or domain, i.e. when no specific channels is assigned then enabling of events is done on the default channel with the name channel0 which created, if not already exists, by the LTTng tracer control on the server side.
Enabling Kernel Events On Session Level
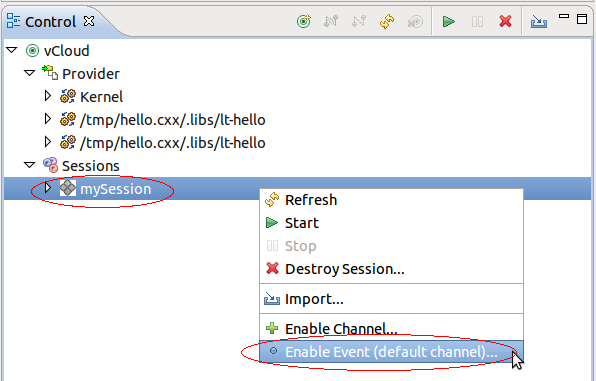
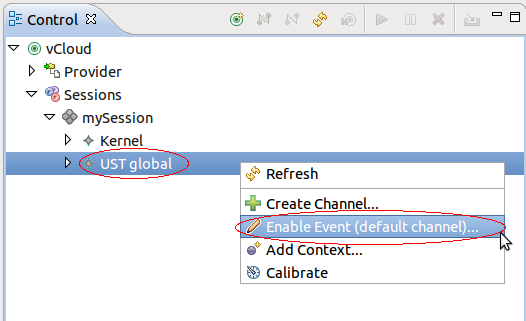
To enable events, select the tree node of the relevant session and press the right mouse button. Then select the Enable Event (default channel)... button of the context-sensitive menu.
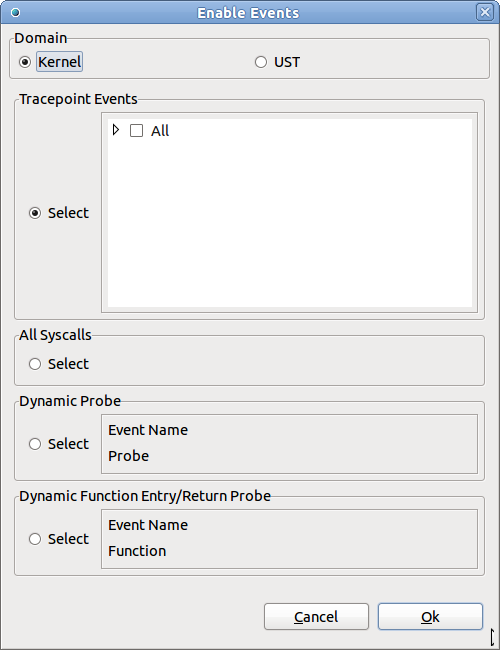
A dialog box will open for entering information about events to be enabled.
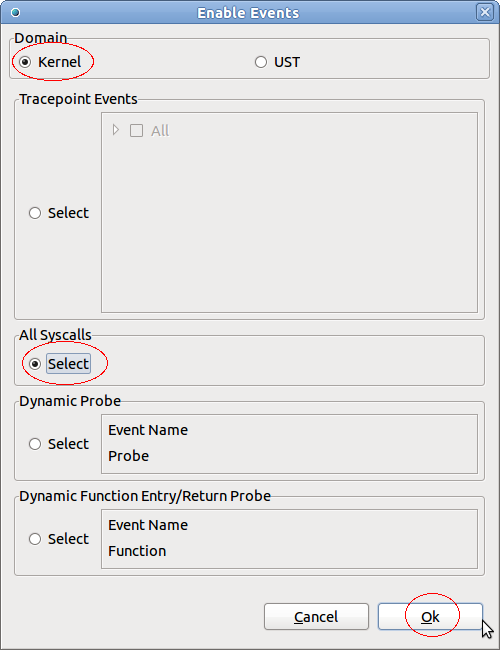
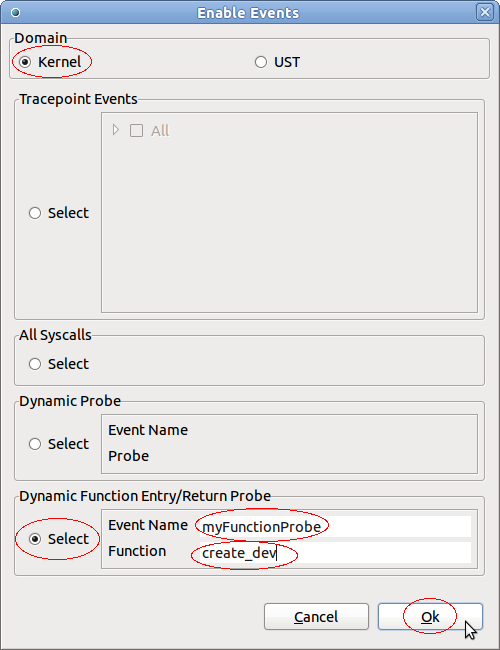
By default the domain Kernel is selected and the kernel specific data sections are created. From this dialog box kernel Tracepoint events, System calls (Syscall), a Dynamic Probe or a Dynamic Function entry/return probe can be enabled. Note that events of one of these types at a time can be enabled.
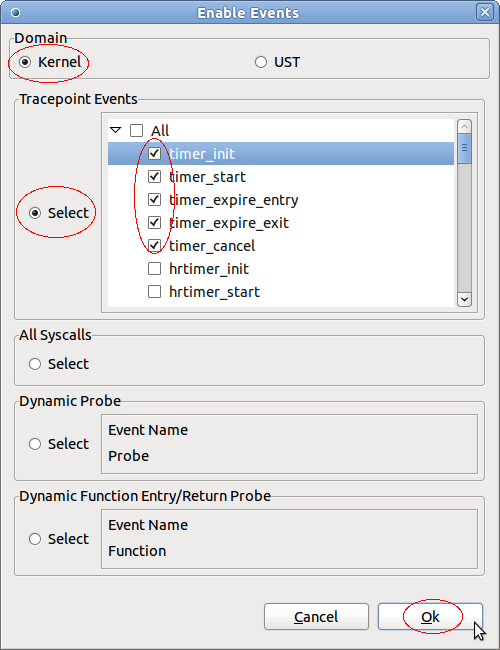
To enable Tracepoint events, first select the corresponding Select button, then select either all tracepoins (select All) or select selectively one or more tracepoints in the displayed tree of tracepoints and finally press Ok.
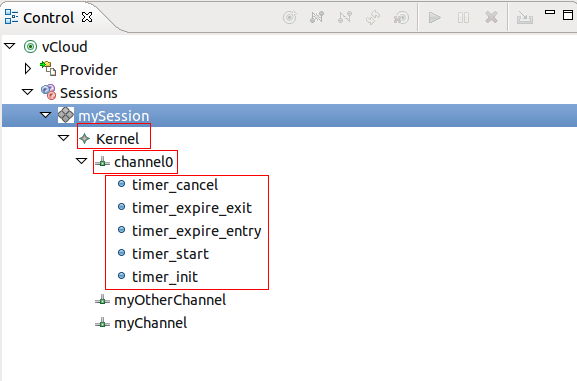
Upon successful operation, the domain Kernel will be created in the tree (if neccessary), the default channel with name "channel0" will be added under the domain (if necessary) as well as all requested events of type TRACEPOINT under the channel. The channel and events will be ENABLED.
To enable all Syscalls, select the corresponding Select button and press Ok.
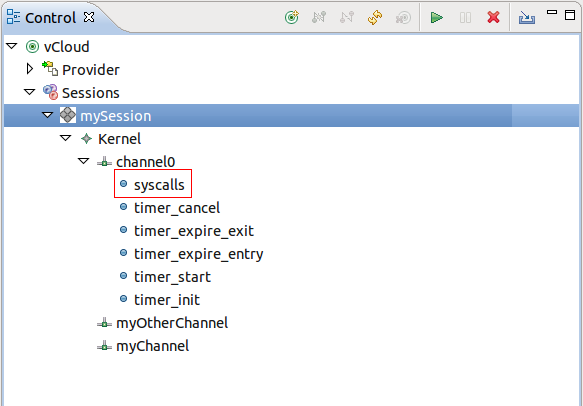
Upon successful operation, the event with the name syscalls and event type SYSCALL will be added under the default channel (channel0). If necessary the domain Kernel and the channel channel0 will be created.
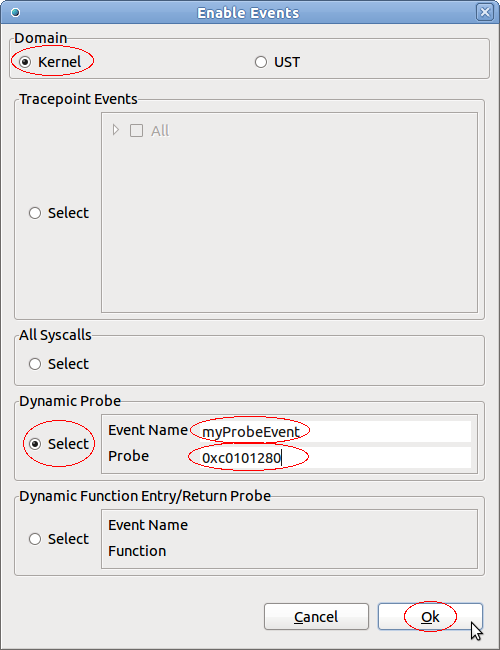
To enable a Dynamic Probe event, select the corresponding Select button, fill the Event Name and Probe fields and press Ok. Note that the probe can be an address, symbol or a symbol+offset where the address and offset can be octal (0NNN...), decimal (NNN...) or hexadecimal (0xNNN...).
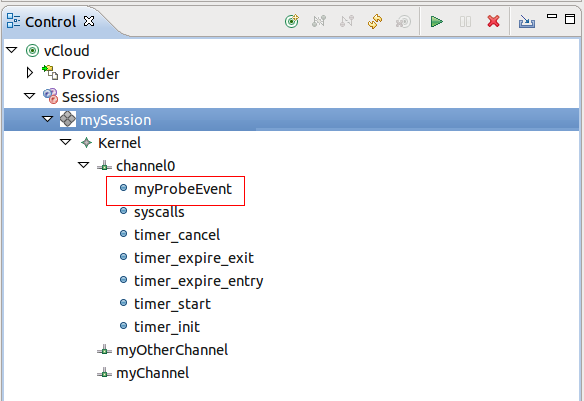
Upon successful operation, the dynamic probe event with the given name and event type PROBE will be added under the default channel (channel0). If necessary the domain Kernel and the channel channel0 will be created.
To enable a Dynamic Function entry/return Probe event, select the corresponding Select button, fill the Event Name and Function fields and press Ok. Note that the funtion probe can be an address, symbol or a symbol+offset where the address and offset can be octal (0NNN...), decimal (NNN...) or hexadecimal (0xNNN...).
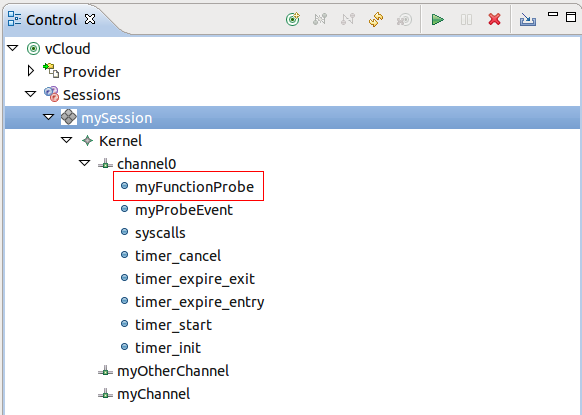
Upon successful operation, the dynamic function probe event with the given name and event type PROBE will be added under the default channel (channel0). If necessary the domain Kernel and the channel channel0 will be created.
Enabling UST Events On Session Level
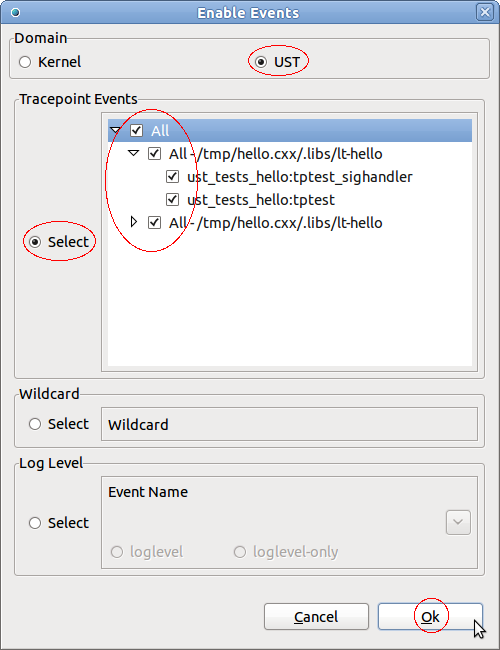
For enabling UST events, first open the enable events dialog as described in section Enabling Kernel Events On Session Level and select domain UST.
To enable Tracepoint events, first select the corresponding Select button, then select either all tracepoins (select All) or select selectively one or more tracepoints in the displayed tree of tracepoints and finally press Ok.
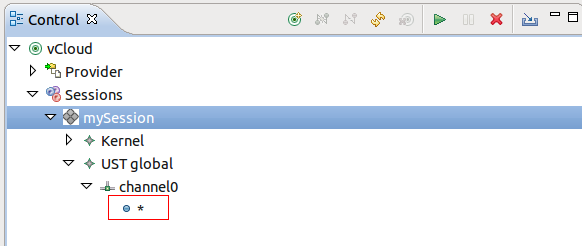
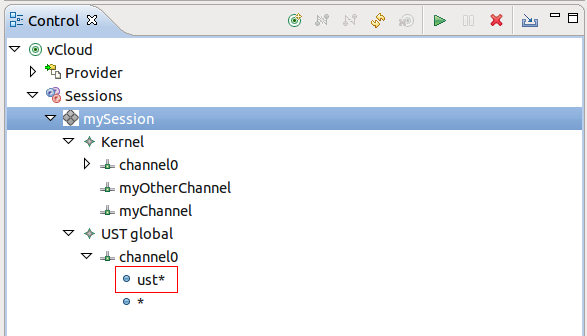
Upon successful operation, the domain UST global will be created in the tree (if neccessary), the default channel with name "channel0" will be added under the domain (if necessary) as well as all requested events under the channel. The channel and events will be ENABLED. Note that for the case that All tracepoints were selected the wildcard * is used which will be shown in the Control View as below.
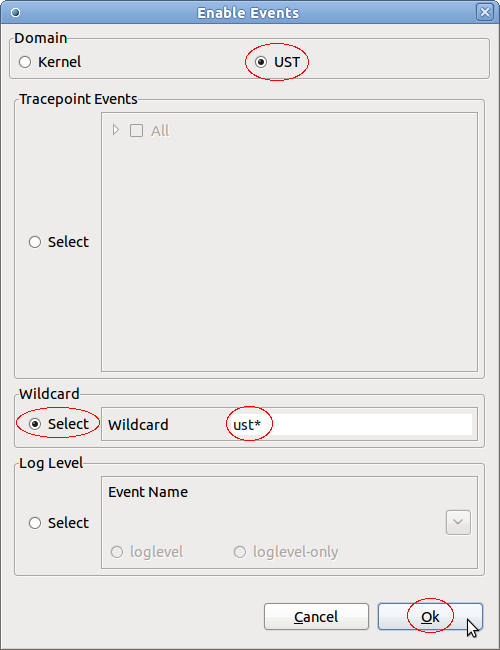
For UST it is possible to enable Tracepoint events using a wildcard. To enable Tracepoint events with a wildcard, select first the corresponding Select button, fill the Wildcard field and press Ok.
Upon successful operation, the event with the given wildcard and event type TRACEPOINT will be added under the default channel (channel0). If necessary the domain UST global and the channel channel0 will be created.
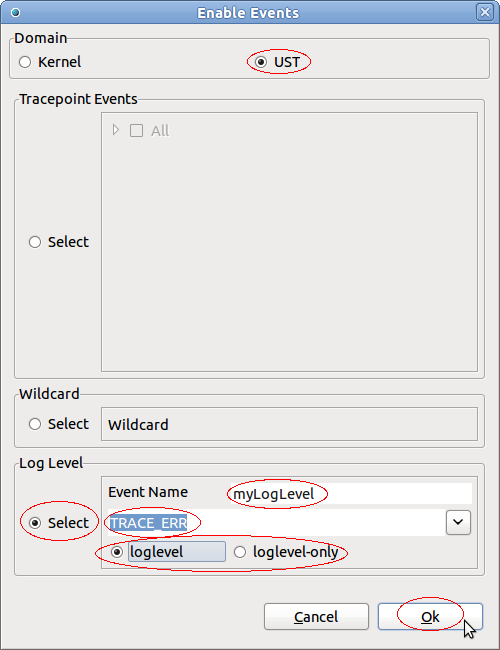
For UST it is possible to enable Tracepoint events using log levels. To enable Tracepoint events using log levels, select first the corresponding Select button, select a log level from the drop down menu, fill in the relevant information (see below) and press Ok.
- Event Name: Name to display
- loglevel: To specify if a range of log levels (0 to selected log level) shall be configured
- loglevel-only: To specify that only the specified log level shall be configured
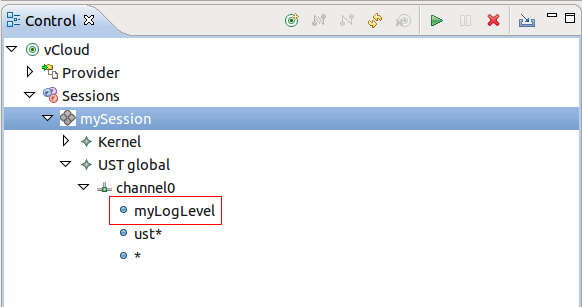
Upon successful operation, the event with the given event name and event type TRACEPOINT will be added under the default channel (channel0). If necessary the domain UST global and the channel channel0 will be created.
Enabling Events On Domain Level
Kernel events can also be enabled on the domain level. For that select the relevant domain tree node, click the right mouse button and the select Enable Event (default channel).... A new dialog box will open for providing information about the events to be enabled. Depending on the domain, Kernel or UST global, the domain specifc fields are shown and the domain selector is preselected and read-only.
To enable events for domain Kernel follow the instructions in section Enabling Kernel Events On Session Level, for domain UST global Enabling UST Events On Session Level.
When enabling events on the domain level, the events will be add to the default channel channel0. This channel will be created by on the server side if neccessary.
Enabling Events On Channel Level
Kernel events can also be enabled on the channel level. If necessary, create a channel as described in sections Creating Channels On Session Level or Creating Channels On Domain Level.
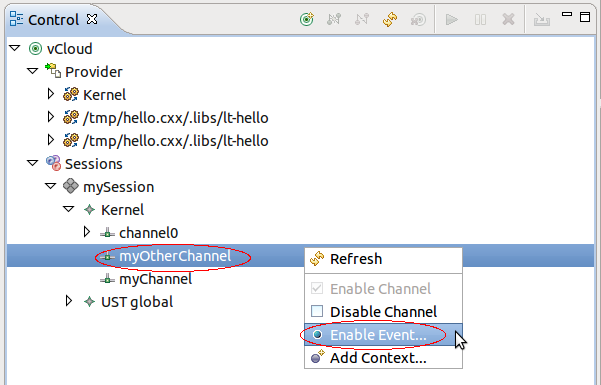
Then select the relevant channel tree node, click the right mouse button and the select Enable Event.... A new dialog box will open for providing information about the events to be enabled. Depending on the domain, Kernel or UST global, the domain specifc fields are shown and the domain selector is preselected and read-only.
To enable events for domain Kernel follow the instructions in section Enabling Kernel Events On Session Level, for domain UST global Enabling UST Events On Session Level.
When enabling events on the channel level, the events will be add to the selected channel.
Enabling and Disabling Events
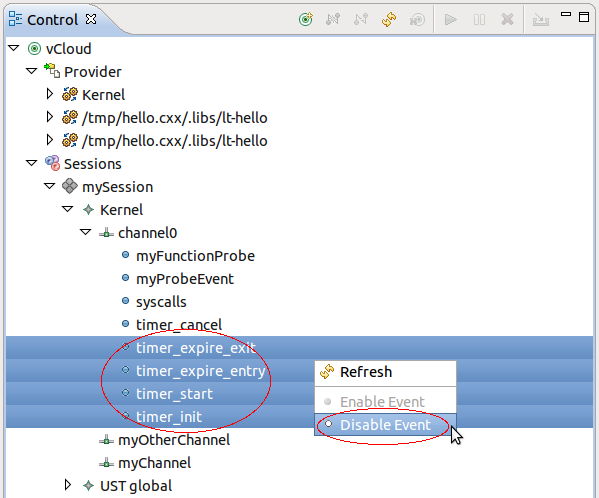
To disable one or more enabled events, select the tree nodes of the relevant events and click the right mouse button. Then select Disable Event menu item in the context-sensitive menu.
Upon successsful operation, the selected events will be DISABLED and the icons for these events will be updated.
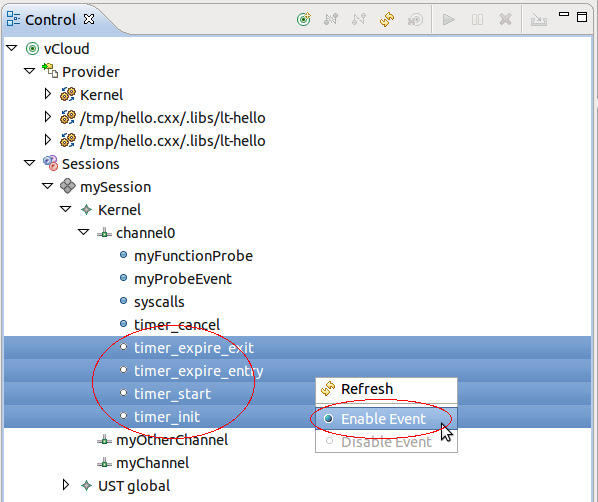
To enable one or more disabled events, select the tree nodes of the relevant events and press the right mouse button. Then select the Enable Event menu item of the context-sensitive menu.
Upon successsful operation, the selected events will be ENABLED and the icons for these events will be updated.
Note: There is currently a limitiation for kernel event of type SYSCALL. This kernel event can not be disabled. An error will appear when trying to disable this type of event. A work-around for that is to have the syscall event in a separate channel and disable the channel instead of the event.
Enabling Tracepoint Events From Provider
It is possible to enable events of type Tracepoint directly from the providers and assign the enabled event to a session and channel. Before doing that a session has to be created as described in section Creating a Tracing Session. Also, if other than default channel channel0 is required, create a channel as described in sections Creating Channels On Session Level or Creating Channels On Domain Level.
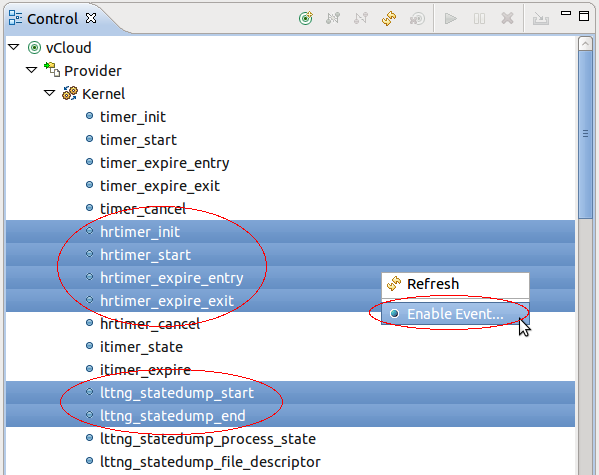
To assign tracepoint events to a session and channel, select the events to be enabled under the provider (e.g. provider Kernel), click right mouse button and then select Enable Event... menu item from the context sesitive menu.
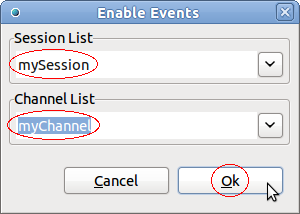
A new display will open for defining the session and channel.
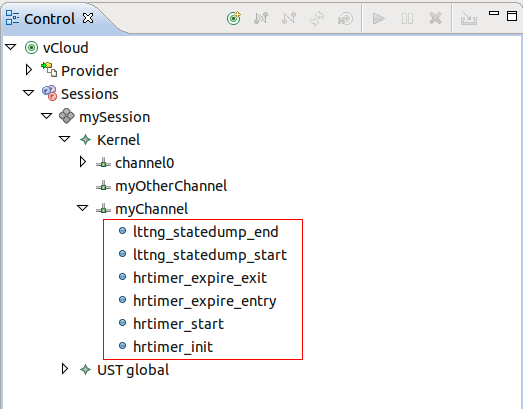
Select a session from the Session List drop-down menu, a channel from the Channel List drop-down menu and the press Ok. Upon successful operation, the selected events will be added to the selected session and channel of the domain that the selected provider belongs to. In case that there was no channel available, the domain and the default channel channel0 will be created for corresponding session. The newly added events will be ENABLED.
Adding Contexts to Channels and Events of a Domain
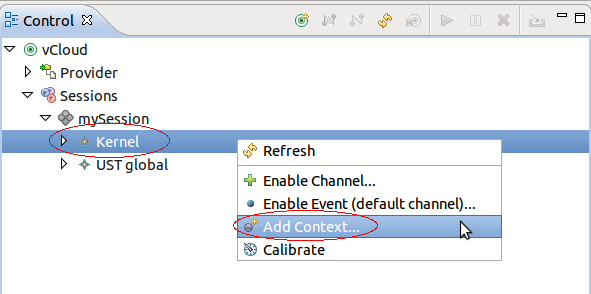
It is possible to add contexts to channels and events. Adding contexts on channels and events from the domain level, will enable the specified contexts to all channels of the domain and all their events. To add contexts on the domain level, select a domain, click right mouse button on a domain tree node (e.g. provider Kernel) and select the menu item Add Context... from the context-sensitive menu.
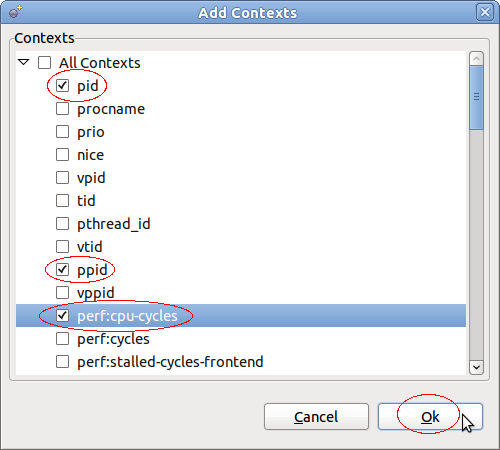
A new display will open for selecting one or more contexts to add.
The tree shows all avaiable context that can be added. Select one or more context and the press Ok. Upon successful operation, the selected context will be added to all channels and their events of the selected domain.
Adding Contexts to All Events of a Channel
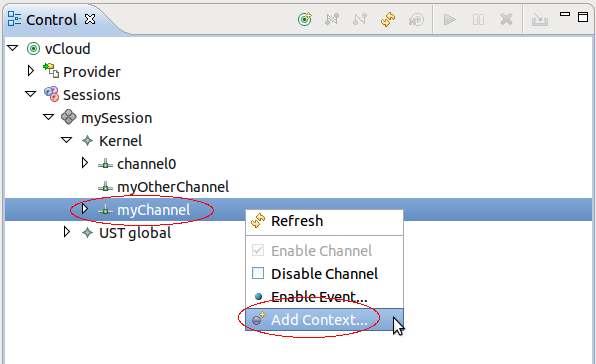
Adding contexts on channels and events from the channel level, will enable the specified contexts to all events of the selected channel. To add contexts on the channel level, select a channel, click right mouse button on a channel tree node and select the menu item Add Context... from the context-sensitive menu.
A new display will open for selecting one or more contexts to add. Select one or more contexts as described in chapter Adding Contexts to Channels and Events of a Domain. Upon successful operation, the selected context will be added to all channels and their events of the selected domain. Note that the LTTng 2.0 tracer control on the remote host doesn't provide a way to retrieve added contexts. Hence it's not possible to display the context information in the GUI.
Adding Contexts to a Event of a Specific Channel
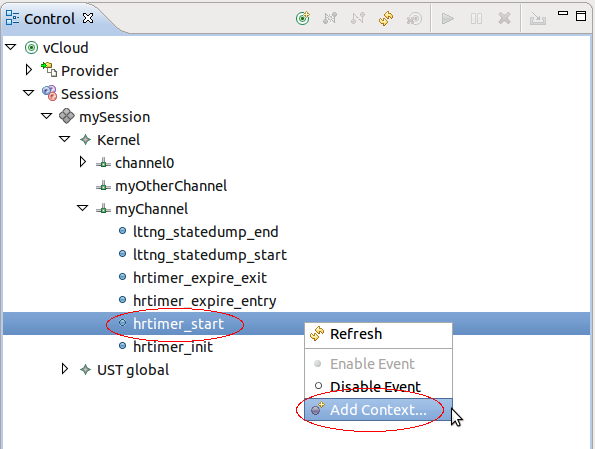
Adding contexts to a event of a channel, select an event of a channel, click right mouse button on the corresponding event tree node and select the menu item Add Context... from the context-sensitive menu.
A new display will open for selecting one or more contexts to add. Select one or more contexts as described in chapter Adding Contexts to Channels and Events of a Domain. Upon successful operation, the selected context will be added to the selected event.
Start Tracing
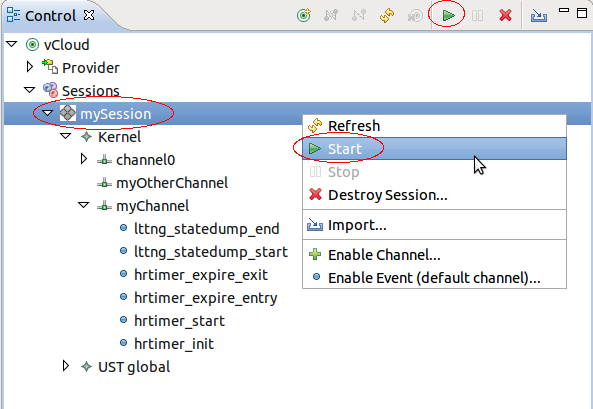
To start tracing, select one or more sessions to start in the Control View and press the Start button. Alternatively, press the right mouse button on the session tree nodes. A context-sensitive menu will show. Then select the Start menu item.
Upon successful operation, the tracing session will be ACTIVE and the icon of the session will be updated.
Stop Tracing
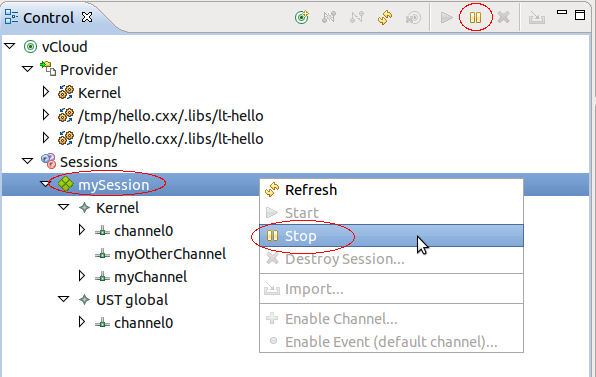
To stop tracing, select one or more sessions to stop in the Control View and press the Stop button. Alternatively, click the right mouse button on the session tree nodes. A context-sensitive menu will show. Then select the Stop menu item.
Upon successful operation, the tracing session will be INACTIVE and the icon of the session will be updated.
Destroying a Tracing Session
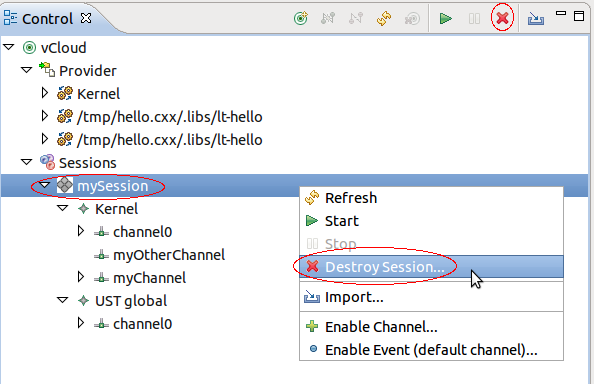
To destroy a tracing session, select one or more sessions to destroy in the Control View and press the Destroy button. Alternatively, click the right mouse button on the session tree node. A context-sensitive menu will show. Then select the Destroy... menu item. Note that the session has to be INACTIVE for this operation.
A confirmation dialog box will open. Click on Ok to destroy the session otherwise click on Cancel.
Upon successful operation, the tracing session will be destroyed and removed from the tree.
Refreshing the Node Information
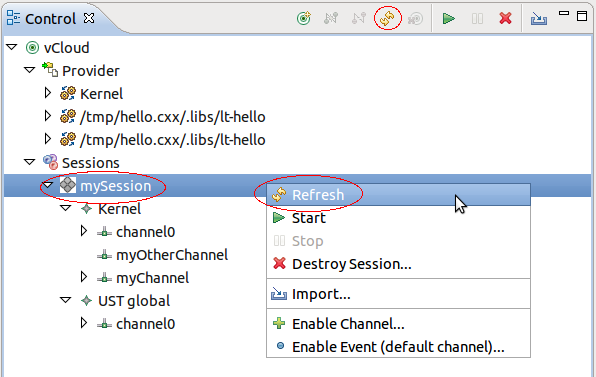
To refresh the remote host information, select any node in the tree of the Control View and press the Refresh button. Alternatively, click the right mouse button on any tree node. A context-sensitive menu will show. Then select the Refresh menu item.
Upon successful operation, the tree in the Control View will be refreshed with the remote host configuration.
Quantifing LTTng overhead (Calibrate)
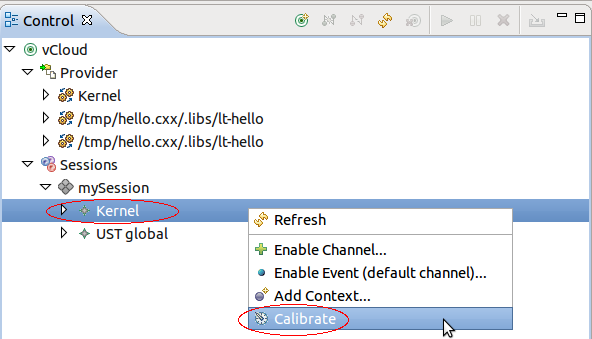
The LTTng calibrate command can be used to find out the combined average overhead of the LTTng tracer and the instrumentation mechanisms used. For now, the only calibration implemented is that of the kernel function instrumentation (kretprobes). To run the calibrate command, select the a domain (e.g. Kernel), click the right mouse button on the domain tree node. A context-sensitive menu will show. Select the Calibrate menu item.
Upon successfull operation, the calibrate command is executed and relevant information is stored in the trace. Note: that the trace has to be active so that to command as any effect.
Importing Session Traces to a Tracing Project
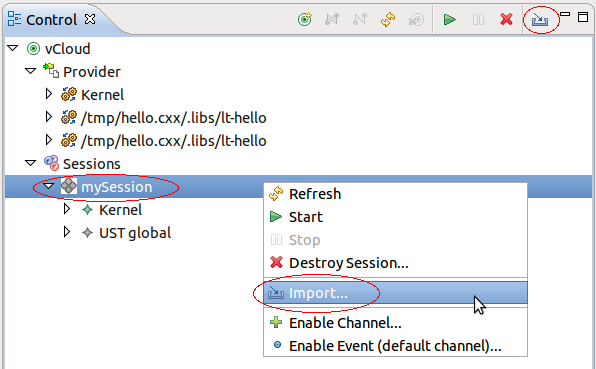
To import traces from a tracing session, select the relevant session and click on the Import Button. Alternativly, click the right mouse button on the session tree node and select the menu item Import... from the context-sensitive menu.
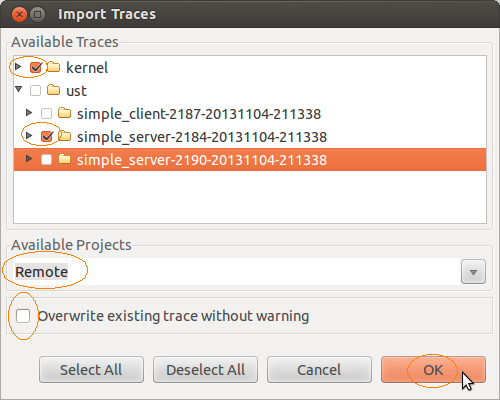
A new display will open for selecting the traces to import.
Select the trace to be imported by selecting the relevant traces in the tree viewer, select a tracing project from the Available Projects combo box and select the Overwrite button (Overwrite existing trace without warning) if required. Then press button Ok. Upon successful import operation the the selected traces will be stored in the Traces directory of the specified tracing project. From the Project Explorer view, the trace can be analysed further.
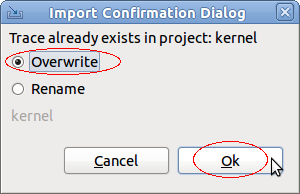
Note: If the overwrite button (Overwrite existing trace without warning) was not selected and a trace with the same name of a trace to be imported already exists in the project, then a new confirmation dialog box will open.
To Overwrite select the Overwrite Button and press Ok.
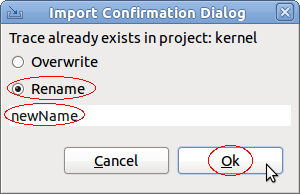
If the existing trace should not be overwritten select, then select the Rename option of the confirmation dialog box above, enter a new name and then press Ok.
Properties View
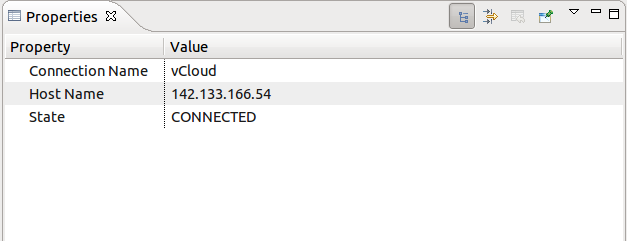
The Control View provides property information of selected tree component. Depending on the selected tree component different properties are displayed in the property view. For example, when selecting the node level the property view will be filled as follewed:
List of properties:
- Host Properties
- Connection Name: The alias name to be displayed in the Control View.
- Host Name: The IP address or DNS name of the remote system.
- State: The state of the connection (CONNECTED, CONNECTING, DISCONNNECTING or DISCONNECTED).
- Kernel Provider Properties
- Provider Name: The name of the provider.
- UST Provider Properties
- Provider Name: The name of the provider.
- Process ID: The process ID of the provider.
- Event Properties (Provider)
- Event Name: The name of the event.
- Event Type: The event type (TRACEPOINT only).
- Log Level: The log level of the event.
- Session Properties
- Session Name: The name of the Session.
- Session Path: The path on the remote host where the traces will be stored.
- State: The state of the session (ACTIVE or INACTIVE)
- Domain Properties
- Domain Name: The name of the domain.
- Channel Properties
- Channel Name: The name of the channel.
- Number of Sub Buffers: The number of sub-buffers of the channel.
- Output type: The output type for the trace (e.g. splice() or mmap())
- Overwrite Mode: The channel overwrite mode (true for overwrite mode, false for discard)
- Read Timer Interval: The read timer interval.
- State: The channel state (ENABLED or DISABLED)
- Sub Buffer size: The size of the sub-buffers of the channel (in bytes).
- Switch Timer Interval: The switch timer interval.
- Event Properties (Channel)
- Event Name: The name of the event.
- Event Type: The event type (TRACEPOINT, SYSCALL or PROBE)..
- Log Level: The log level of the event.
- State: The Event state (ENABLED or DISABLED)
LTTng Trace Control Preferences
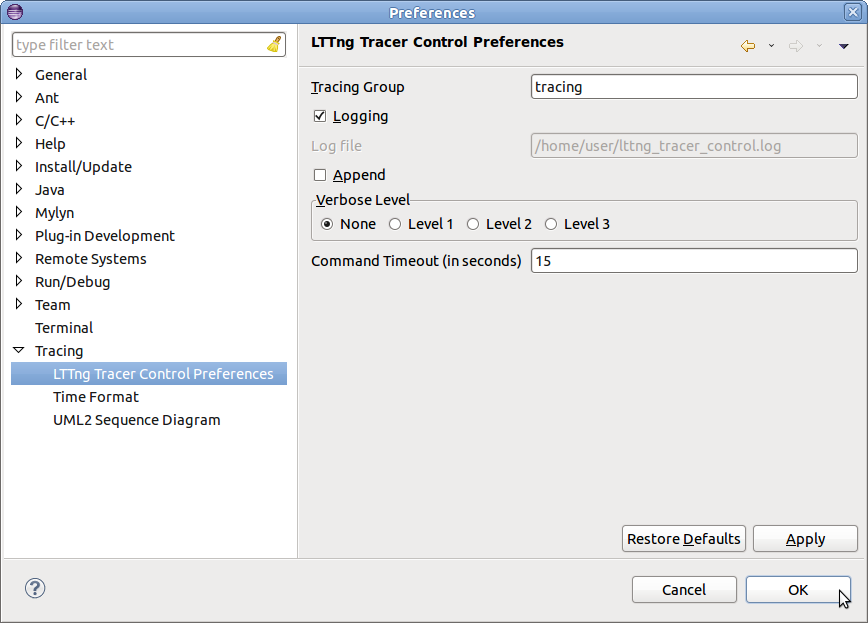
Serveral LTTng 2.0 tracer control preferences exists which can be configured. To configure these preferences, select Window->Preferences from the top level menu. The preference display will open. Then select Tracing->LTTng Tracer Control Preferences. This preferences page allows the user to specify the tracing group of the user and allows the user to configure the logging of LTTng 2.0 tracer control commands and results to a file.
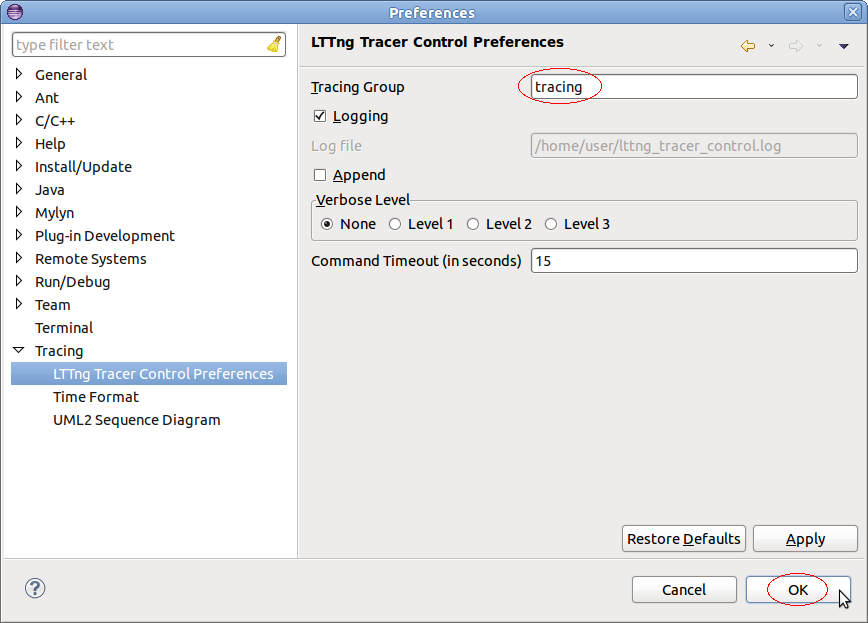
To change the tracing group of the user which will be specified on each command line, enter the new group name in the Tracing Group text field and click ok. The default tracing group is tracing and can be restored by pressing the Restore Defaults button.
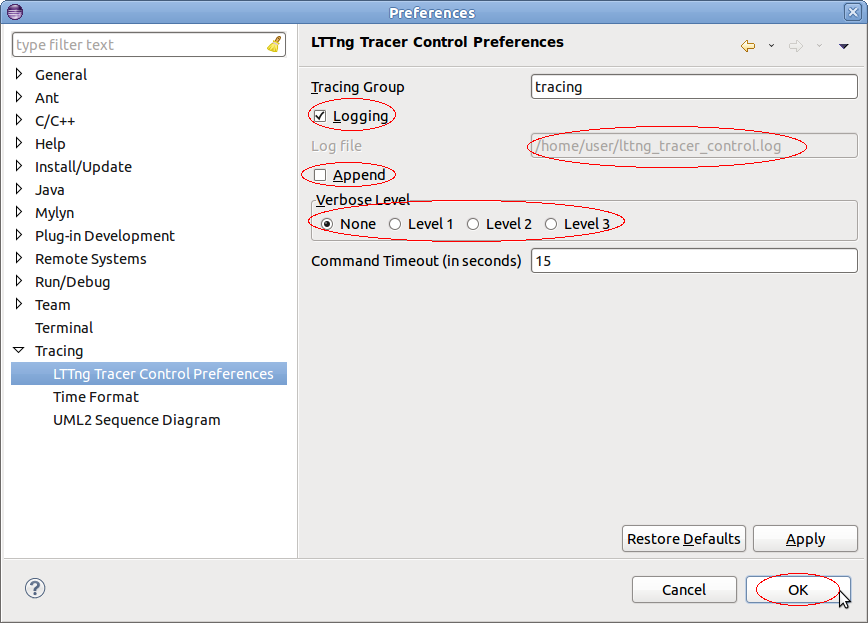
To configure logging of trace control commands and the corresponding command result to a file, selected the button Logging. To append to an existing log file, select the Append button. Deselect the Append button to overwrite any existing log file. It's possible to specify a verbose level. There are 3 levels with inceasing verbosity from Level 1 to Level 3. To change the verbosity level, select the relevant level or select None. If None is selected only commands and command results are logged. Then press on button Ok. The log file will be stored in the users home directory with the name lttng_tracer_control.log. The name and location cannot be changed. To reset to default preferences, click on the button Restore Defaults.

