Notice: This Wiki is now read only and edits are no longer possible. Please see: https://gitlab.eclipse.org/eclipsefdn/helpdesk/-/wikis/Wiki-shutdown-plan for the plan.
Difference between revisions of "VIATRA/Transformation/EVM Adapter Framework"
| Line 20: | Line 20: | ||
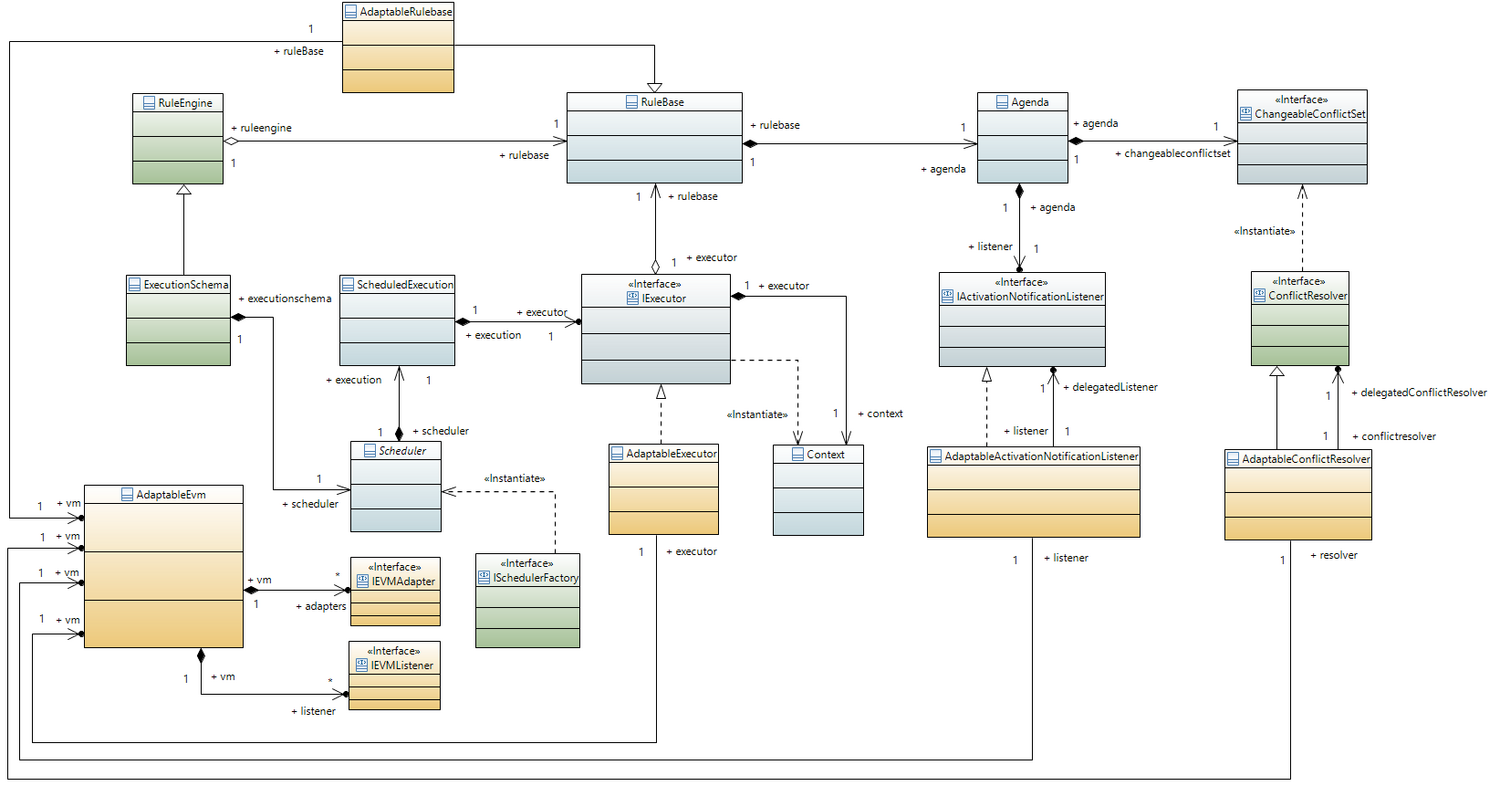
== Connection with EVM == | == Connection with EVM == | ||
| − | [[File:EVMAdapter_Class.png]] | + | [[File:EVMAdapter_Class.png | 1500px]] |
== Defining adapter and listener implementations == | == Defining adapter and listener implementations == | ||
Revision as of 10:38, 1 April 2016
Contents
Motivation
The development and debugging of reactive event-driven model transformations is not a trivial exercise, the basic concepts of software debugging however can be mapped to the field of model transformations. Debuggers can be used for detecting bugs, as well as better understanding the structure and behavior of programs. Direct control over a program allows the programmer to follow the flow of execution or stop the program at any desired point. Then it is possible to inspect its current state and verify the correctness of the software. These properties are very desirable in the field of model transformations as well. The VIATRA framework possesses a solution for implementing transformation debugging related functionalities.
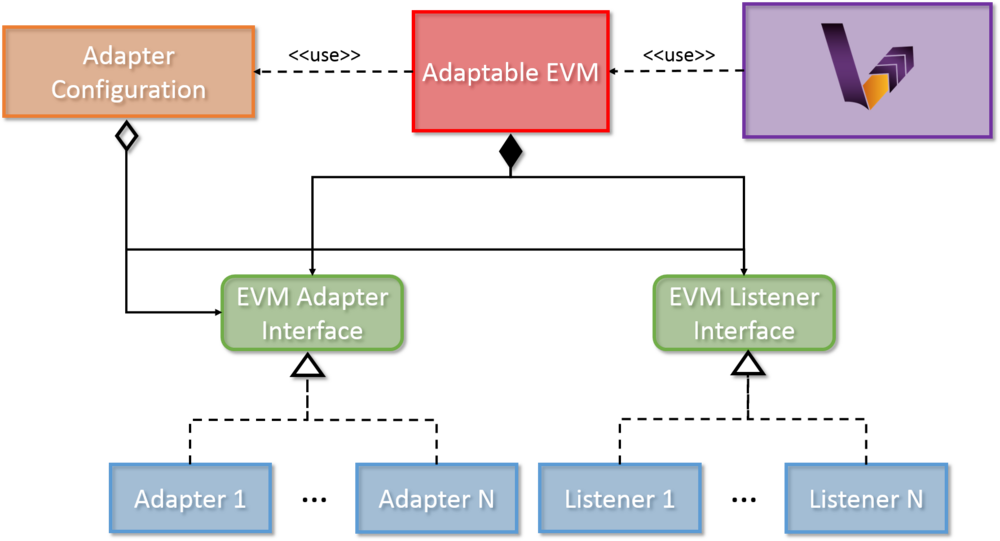
A full featured transformation debugger requires a software solution that is able to observe and control model transformations. Such an extension is able to insert additional functionality into certain points during model transformations. The transformation adapter framework allows the definition of additional functionalities that are executed at certain points in event-driven model transformations. The previously described debug functionalities are implemented using the EVM adapter framework.
High level architecture
Components
- *Transformation Debug Listener*: Repsonsible for displaying the state of the VIATRA transformation using a specific Debugger UI.
- *Transformation Debug Adapter*: Responsible for halting the execution of the transformation if a breakpoint is reached. Once the breakpoint is encountered, it allows the user to select the next action to be taken via the Debugger UI.
- *Debugger UI*: Responsible for displaying the internal state of the model transformation in progress, and it allows the transformation developer to manipulate the execution sequence. Using this component enables the transformation debugger component to remain UI independent, and support the definition of custom user interface implementations.
 * *Console Debugger UI*: This default UI implementation uses the standard input and output in order to communicate with the transformation developer.
 * *VIATRA Viewers Debugger UI*: In this case the VIATRA  Viewers framework is utilized to visualize the target and source model state via using annotated VIATRA queries.
- *Breakpoints*: Each breakpoint realization compares a given activation to a set of constraints. If the constraints match, the debugger is informed that it should halt the execution of the transformation, and wait for a response from the transformation developer.
 * *Rule Activation Breakpoints*: Contains references to a transformation rule, a lifecycle state, and a set of source model elements that have triggered the activation. This way the debugger can check if the activation being fired has a breakpoint attached to it or not.
 * *Conditional Breakpoints*: These breakpoints are able to define global constraints that are not only affected by the current activation. A similar concept is available in the Eclipse Java Development Tools (JDT). The constraints are defined by using the VIATRA query language.
- *Transformation Debugger Configuration*: This configuration binds the transformation debug adapter and listenercomponents together and allows a more straightforward usage.


